Neural rainfall hindcasts with moisture-budget regularisation and infrared satellite features
Adrian Dunkley
Climate Studies Group Mona, Department of Physics, The University of the
West Indies, Mona, Jamaica
adrian.dunkley@mymona.uwi.edu
Abstract
This retrospective technical study tests whether a moisture-budget penalty and calibrated infrared satellite features improve next-day rainfall prediction near Jamaica. Nine neural networks were trained on daily reanalysis fields for 2001–2025, using chronological training, validation and evaluation periods. A separate twelve-network experiment compared weather-only and infrared-augmented inputs on 640 matched fortnightly dates. In the daily experiment, validation-selected neural rainfall root mean squared errors were 3.827–3.945 mm/day, compared with 4.258 for persistence and 3.808 for an equal-input linear model. Stronger budget penalties reduced an approximate moisture residual but increased vapour-state error. Infrared augmentation worsened rainfall error in each of three selected paired comparisons, while linear comparators again performed better. These findings support retaining simple baselines and separating agreement with a physical penalty from prediction accuracy. The targets are revised model-derived reanalysis, not independent gauges; neither experiment establishes operational forecast skill or field-validated flood impacts.
Keywords: rainfall hindcasting; moisture budget; neural networks; infrared imagery; chronological validation; Jamaica.
1. Introduction
Rainfall model development requires two distinct tests: whether predictions improve on simple alternatives and whether their behaviour is consistent with the physical quantities being modelled. A lower constraint residual need not imply a more accurate atmospheric state. Satellite information can also add parameters and noise without improving a particular forecast pipeline.
This study asks whether an approximate daily moisture-budget penalty improves next-day rainfall and water-vapour prediction at one coarse grid cell near Jamaica, and whether pooled infrared features add predictive value on a matched subset. The contribution is an executed, reproducible comparison with retained negative findings. It is not a claim of a new physical law, a locally calibrated warning system or superiority of neural models. The monthly rainfall-planning framework and synthetic transport checks are separate studies with different targets and temporal support.
2. Data and methods
2.1 Reanalysis data and chronological design
The training inputs and targets are retained daily NOAA NCEP–NCAR Reanalysis 1 regional arrays for 2001–2025. Every annual checksum was checked against its original provenance record. This run uses the coarse 2.5-degree cell centred 17.5 degrees north, 77.5 degrees west, covering land and sea near Jamaica. It is not a parish-scale rainfall product.
Training target dates end 2016; validation covers 2017–2019; evaluation covers 2020–2025. Normalisation and monthly-climatology baselines use training only. For target day , the neural input uses completed day and , never target-day rainfall or weather. The nominal issue time is after completion of day . However, revised reanalysis archives are not as-issued operational records. Precipitation is a model-derived reanalysis field, not independent gauge truth. These historical years were already used in earlier research; they are not a newly untouched scientific holdout.
2.2 Neural architectures and training
Nine neural networks were trained. Each has two hidden layers of 32 and 16 hyperbolic-tangent units, a two-output softplus head and 12 input features. The outputs are next-day column water vapour and precipitation. Inputs are the previous day’s vapour, effective wind components, temperature, pressure, evaporation, precipitation, horizontal vapour-flux divergence, preceding-day vapour and precipitation, and two seasonal coordinates. Softplus enforces nonnegative vapour and precipitation. Training used 160 epochs, Adam learning rate 0.002, batches of 256, three seeds and budget-loss strengths 0, 0.01 and 0.1. All weights, predictions, inputs and losses are saved.
This is physics-regularised supervised forecasting, not a continuous-coordinate partial-differential-equation-solving physics-informed neural network. The earlier physics-informed transport network remains a separate synthetic experiment.
2.3 Approximate moisture-budget regularisation
The daily diagnostic is
Here indexes the input day; is daily-mean column water vapour, is input-day evaporation, is next-day precipitation, and is input-day horizontal moisture-flux divergence. Hats mark neural predictions. Vapour is measured in kilograms per square metre, numerically equivalent to millimetres of liquid-water depth; evaporation, precipitation and divergence are converted to daily water-depth equivalents. The loss adds to supervised vapour and rainfall losses scaled by 20 and 5 respectively. Divergence is calculated from the product of column water and effective winds using centred spherical finite differences.
This freezes input-day evaporation and divergence across the forecast day. Daily mean vapour states and daily flux intervals also do not constitute exact endpoint budgets. The effective winds approximate vertically integrated transport, and unresolved closure is omitted. Therefore the residual is an approximate regularisation target, not exact atmospheric conservation. The reference values themselves have a 9.96 mm/day root mean squared residual against this frozen-forcing relation. Reducing it can move predictions away from the reanalysis state.
2.4 Satellite cohort and matched comparison
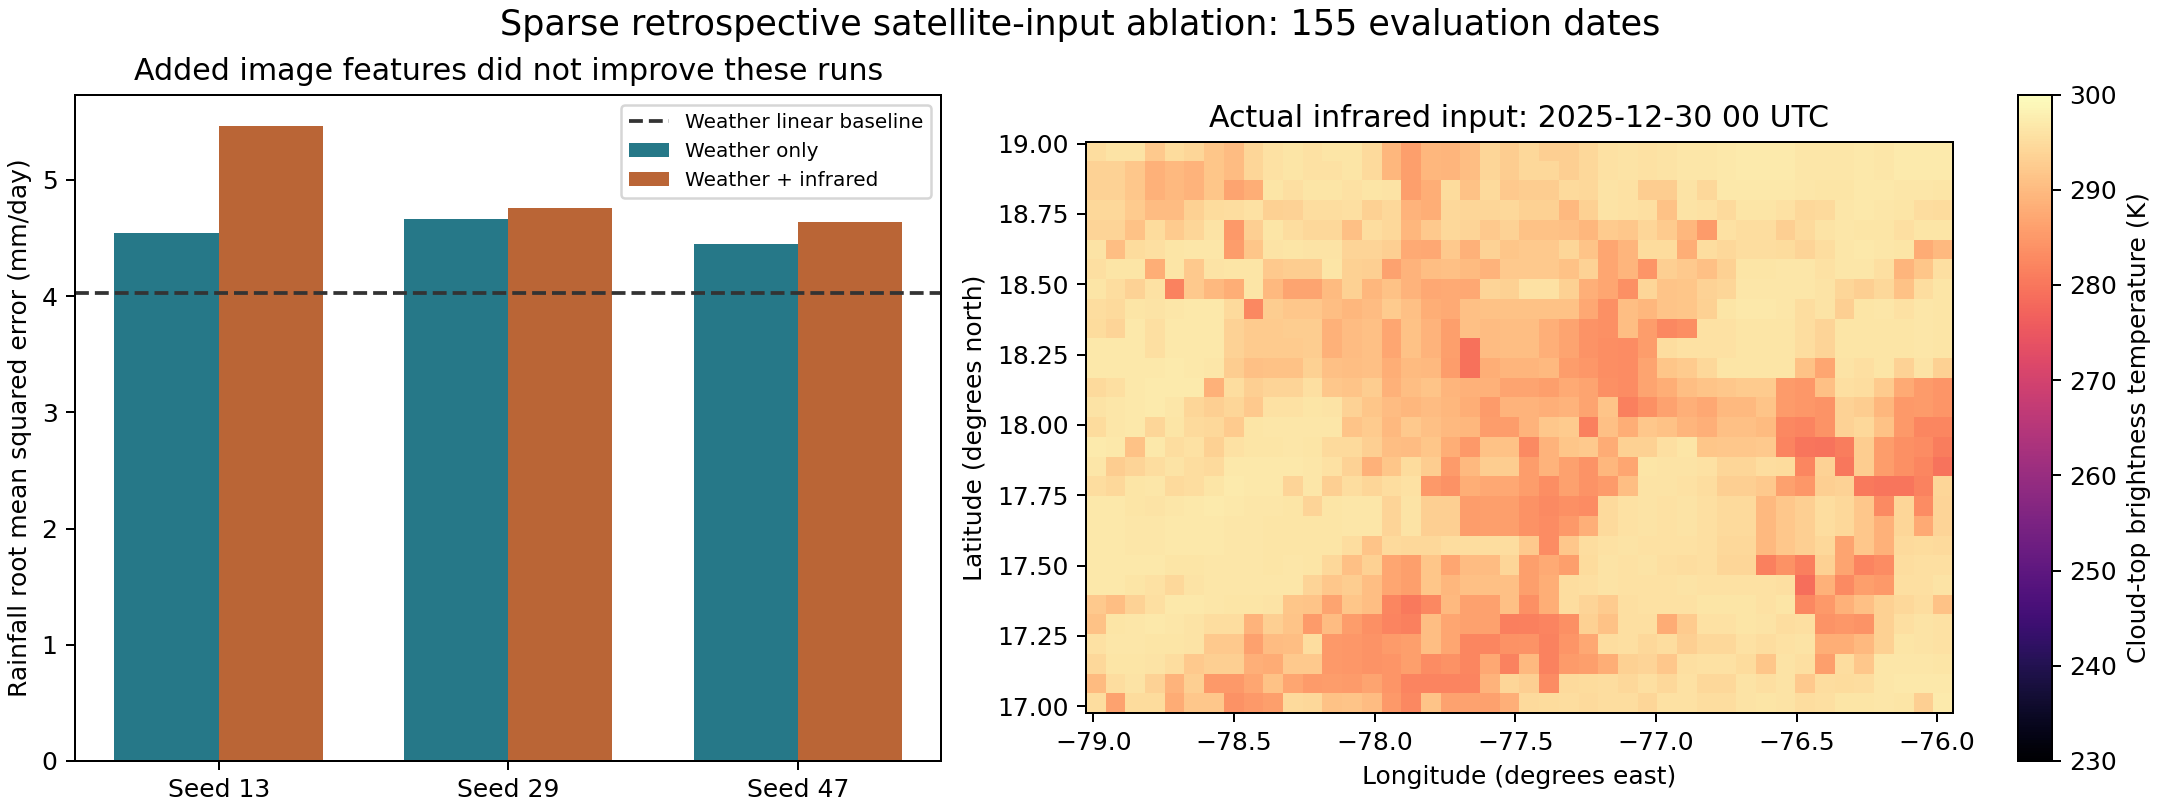
A separate matched-cohort experiment now uses actual calibrated infrared imagery. NOAA GridSat-B1 supplies cloud-top brightness temperature, not rainfall ground truth. A fixed fortnightly date list from 2 January 2001 through December 2025 contained 653 requested images. There were 641 successful downloads, twelve recorded HTTP failures and one entirely missing image. The quality rule retained 640 dates with at least 90% finite pixels: 409 training, 76 validation and 155 evaluation cases. All failures remain documented; no dates were selected by model performance.
The near-11-micrometre calibrated channel was decoded from packed integers using its published scale and offset. A raw subset was independently checked against the original NOAA file, and packing metadata were checked across all 25 years. Constant scale and offset do not prove homogenised calibration: metadata describe differing calibration corrections, and satellite/sensor transitions remain a limitation. Image times are nominally 00:00 UTC, with coverage extending approximately to 00:30. They precede the next-day target; retrospective calibration and archive availability still prevent an as-issued claim.
For each image, sixteen equal-index patch means summarise the 29-by-44-pixel field. The extended network receives these image-derived features plus the same twelve weather features. This is an image-feature multilayer perceptron, not a convolutional image model. Both arms use exactly the same retained dates, training-only scaling and imputation, two hidden layers of 16 and 8 units, three seeds, 300 epochs and two penalty strengths. An independent random generator pairs minibatch orders across arms. The image arm has more first-layer parameters, so capacity is a remaining confound.
2.5 Computational verification
Completed: input hash checks, chronological feature/target construction, training-only scaling, persistence/climatology comparators, three seeds, three regularisation strengths, saved weights, a six-parameter central-difference gradient spot check (maximum discrepancy ), output-positivity check, physics/accuracy trade-off, heavy-rain diagnostics and conditional block resampling. Independent review reconstructed all nine predictions and metrics, rebuilt the raw-data features/divergence, checked chronology and checked all 978 gradient components (maximum absolute discrepancy ). The author spot check was extended by the independent full-parameter gradient check; deterministic repeats, independent reimplementation, missing-input stress tests, a broader tuning budget and prospective data remain further work.
The protocol hash is a local integrity check, not externally timestamped preregistration. Models used fixed final epochs; test outcomes were not used to select the loss strength. All nine test results are retained, not only the favourable one.
3. Results
3.1 Daily rainfall, vapour and budget errors
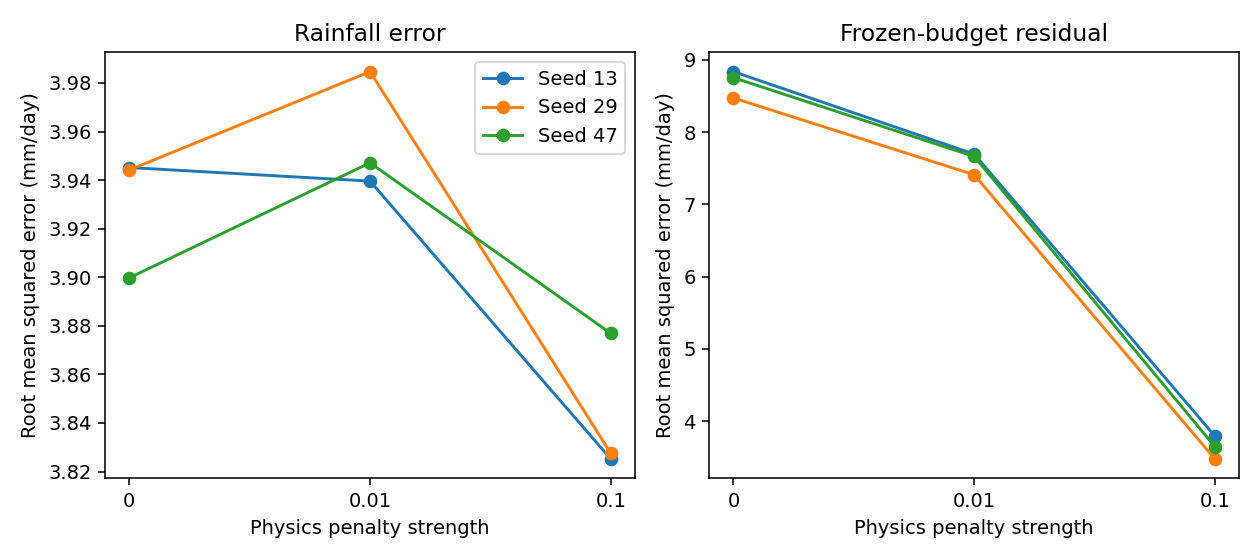
Selecting the loss strength by validation rainfall error separately for each seed gives test rainfall root mean squared errors 3.945, 3.827 and 3.877 mm/day. Persistence gives 4.258 and training-only calendar-month climatology 4.983. Mean absolute errors are 2.490, 2.453 and 2.528 versus persistence 2.542. These are archive-target metrics, not percentages of accurate local weather forecasts.
The 0.1 penalty reduces the budget residual to 3.47–3.79 mm/day across seeds versus 8.48–8.84 without the penalty. But column-water error rises to 5.88–5.92 kg per square metre versus 3.54–3.75 without it. The better residual therefore comes with a worse state prediction. All sampled rainfall outputs are nonnegative by construction.
A post-hoc at least 10 mm/day threshold reveals a further weakness: selected networks recall only 30.8–37.3% of 201 reference days, versus 45.8% for persistence. Their precision improves to 55.6–60.8% versus 45.8%, but they miss more exceedance days. They must not be presented as validated flood warnings.
Post-hoc circular 30-day block bootstrap intervals for network-minus-persistence mean squared error are [-5.32, 0.80], [-5.41, -1.60] and [-5.41, -0.64] in squared daily-depth units. One interval includes zero. These conditional intervals assume the circular blocks adequately represent temporal dependence and stationarity. They do not include training or model-selection uncertainty. They were not a preregistered primary test.
A reviewer-requested equal-input nonnegative-clipped linear comparator was then fitted on the same standardised features. Its regularisation was selected using validation rainfall error; zero regularisation won. Test rainfall root mean squared error is 3.808 mm/day and mean absolute error is 2.451 mm/day. This simpler model outperforms every validation-selected neural model on rainfall root mean squared error. The neural architecture therefore has not established an advantage over a strong simple comparator.
3.2 Satellite-input comparison
Twelve additional neural networks were trained. Independent review reconstructed both feature arms, all twelve predictions and metrics, all 641 raw-response hashes and decoded images, and full gradients for the two architectures; maximum discrepancies were below . After validation-only penalty selection, weather-only evaluation rainfall errors were 4.541, 4.664 and 4.452 mm/day for seeds 13, 29 and 47. Adding infrared features produced 5.462, 4.756 and 4.636 mm/day respectively: all three paired comparisons were worse. Nonnegative-clipped linear comparators gave 4.026 mm/day without imagery and 4.038 with imagery; persistence gave 4.472. These sparse-cohort scores must not be compared directly with the daily experiment as though their samples were identical.
4. Discussion
The daily linear comparator provides evidence against attributing an advantage to depth in this experiment. The neural models improve some average errors relative to persistence, but miss more heavy-rain days at the reported threshold. Different metrics therefore support different decisions, and average rainfall error cannot substitute for warning-system evaluation.
The budget penalty enforces agreement with a frozen-forcing approximation that the reference data themselves do not satisfy exactly. Its adverse vapour result is consistent with tension between that approximation and the supervised target. Likewise, the satellite comparison tests one sparse pooled-feature pipeline; it does not show that infrared observations lack predictive information.
5. Limitations
The single coarse cell includes land and sea, while satellite coverage has different spatial support. Revised archives do not establish original issue-time availability, and evaluation years had been studied previously. Reanalysis precipitation is not independent gauge truth. Daily means and frozen fluxes do not form an exact endpoint moisture balance. Sparse imagery, acquisition failures, sensor transitions and different parameter counts restrict attribution. Conditional resampling does not include training or selection uncertainty. Independent spatial, event and prospective validation remains absent.
6. Future work
This experiment establishes that satellite-derived inputs were implemented and tested, not that they improved prediction. The small training cohort, coarse target, cloud-to-rain ambiguity, sparse sampling and simple pooling may limit the approach. Further work should acquire denser image sequences, test temporal or convolutional encoders against matched linear baselines, retain source-timing constraints and evaluate independent gauges. Such changes require fresh validation decisions rather than tuning to the reported evaluation outcomes.
7. Conclusion
The tested neural models did not outperform the equal-input linear rainfall comparator. Physical regularisation improved its targeted residual while worsening vapour accuracy, and the tested infrared augmentation did not improve selected-pipeline rainfall error. The next development stage should address data timing, independent observations and denser image sequences before considering an operational service.
8. Data, code and explanatory companion
The local dashboard mockup displays actual executed results and historical daily replay. It explicitly separates forecasts from crop/flood impact simulations and shows the separate satellite-input experiment and its adverse result. Impacts require separate soil, drainage, crop and exposure assumptions and independent field observations. No operational warning or simulated damage number is generated by this rainfall model.
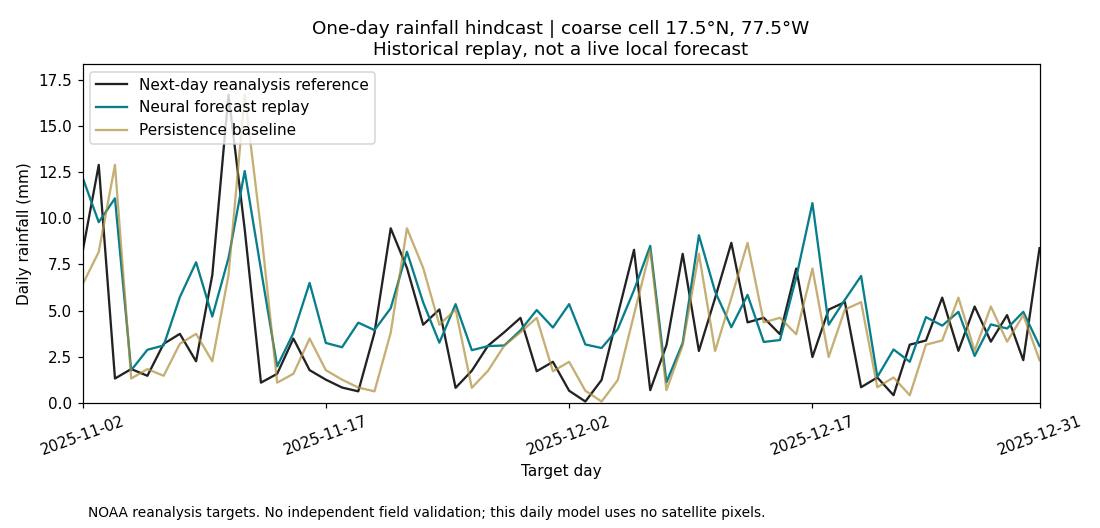
Training arrays, weights, per-case predictions, protocols, source hashes and independent computational checks are retained in the private analysis archive. The official source datasets and documentation are publicly accessible through the cited providers; this report does not imply public access to the analysis archive. The explanatory dashboard and animations present historical results; they do not add validation evidence.
References
- NOAA NCEP–NCAR Reanalysis documentation.
- NOAA surface-flux documentation.
- NOAA GridSat calibrated-channel definition and access.
Original acquisition metadata and annual data sidecars are retained in the private supporting archive. Reusing these inputs does not recertify earlier model performance.
Satellite data citation: Knapp and NOAA CDR Program (2014), NOAA Climate Data Record of Gridded Satellite Data from ISCCP B1 Infrared Channel Brightness Temperature, Version 2, DOI 10.7289/V59P2ZKR. Method: Knapp et al. (2011), Globally Gridded Satellite Observations for Climate Studies, DOI 10.1175/2011BAMS3039.1. Source version identifiers are retained for reproducibility.