Choose how to read
The full view retains the technical content, figures and sources. The plain-language explanation introduces the ideas without changing the findings.
How to read the research dashboard
Explanation
The dashboard replays past data and model estimates. It does not issue today's weather forecast. Rainfall error measures agreement with the reference dataset; budget error measures agreement with a simplified water rule. They answer different questions.
Animation
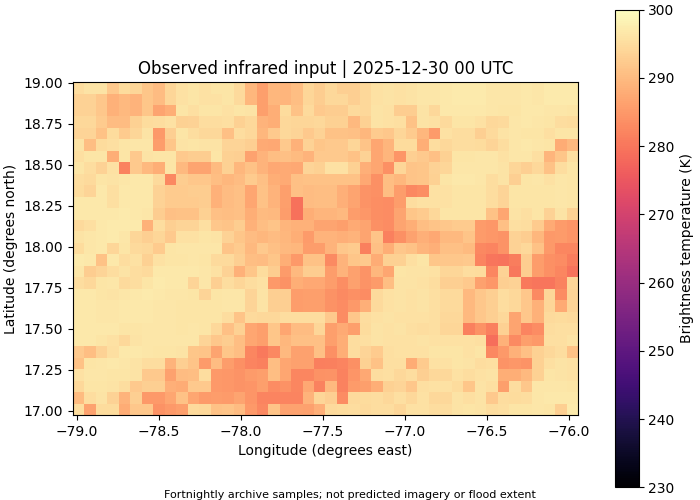
The rainfall animation gradually reveals a historical comparison. The infrared animation shows observed satellite images from past dates. Neither animation is a predicted flood map.
Decision
Look at the simple baseline, the heavy-rain misses and the limits as well as the main error number. A more complex model is useful only if its evidence supports the decision you want to make.
Use the full view for the complete technical discussion, figures, interactive elements and sources.
Rainfall research dashboard
Mockup using executed historical results. Not a live forecast, warning service or validated impact tool.
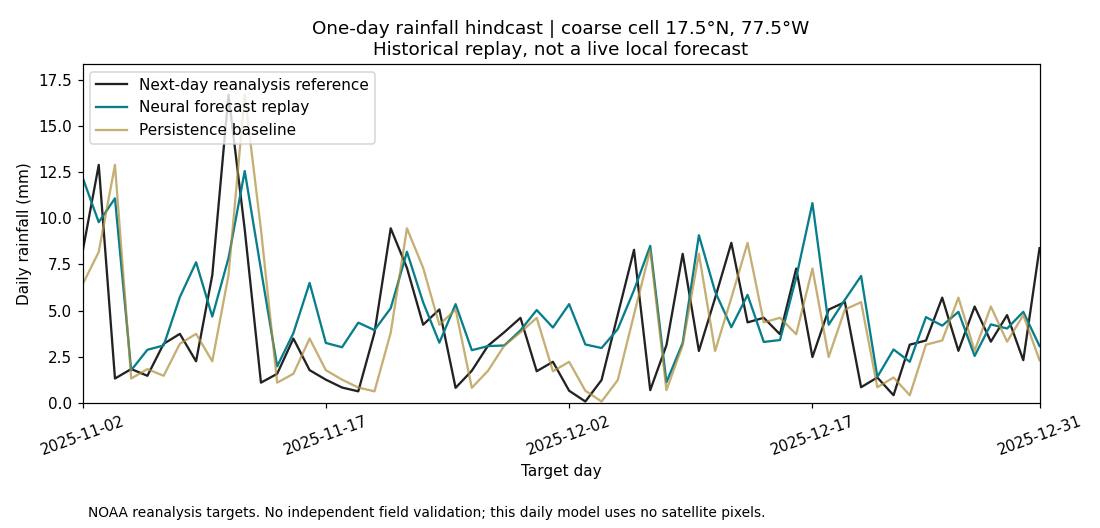
Coarse NOAA cell centred 17.5°N, 77.5°W. Daily targets 2020–2025. Model selected by validation data 2017–2019; seed 29, physics penalty 0.1.
Historical rainfall forecast replay
Each point predicts the next daily reanalysis estimate using prior-day information. Revised archives do not prove real-time issue-date availability.
Physics and accuracy are separate checks
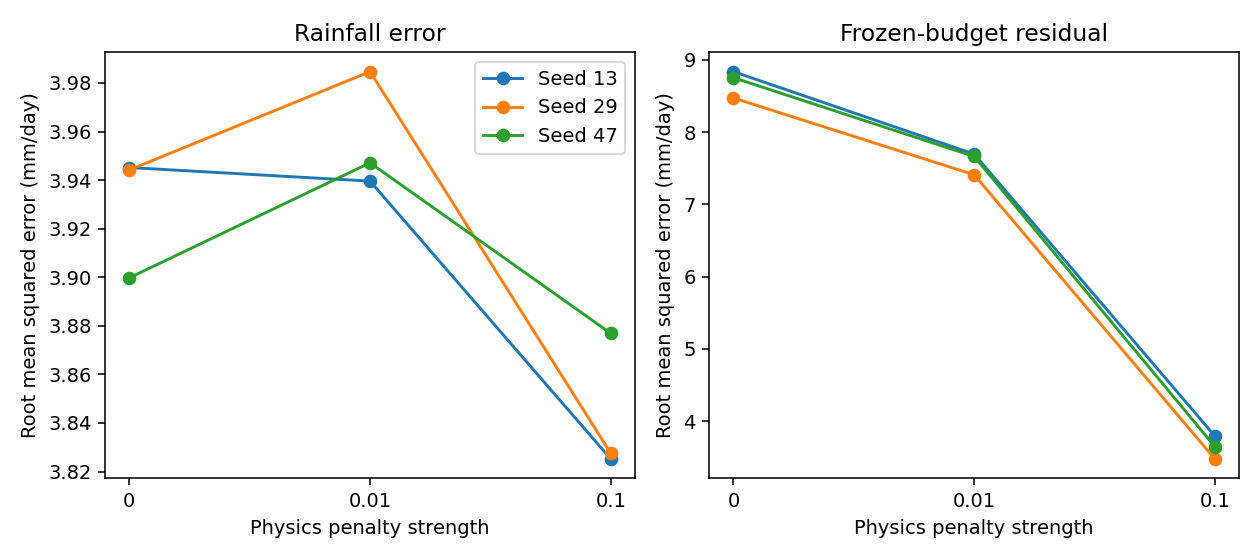
The largest penalty worsened column-water error. The reference data themselves have 9.96 mm/day residual under this approximate frozen-forcing budget. Better agreement with this simplified constraint is not proof of better atmospheric physics.
All three selected runs
Rainfall root mean squared error: seed 13, 3.945; seed 29, 3.827; seed 47, 3.877 mm/day. The replay uses seed 29, which also has the lowest validation error. Full results for all nine networks.
A simpler model did better
The validation-selected nonnegative-clipped linear predictor has rainfall error 3.81 mm/day, lower than every selected neural run. More model complexity did not establish better accuracy.
Satellite inputs were tested
A separate matched experiment used 640 calibrated infrared images, with 409 training, 76 validation and 155 evaluation dates. Twelve additional networks were trained. Adding image features worsened rainfall error in all three paired selected runs. This does not establish an imagery benefit.
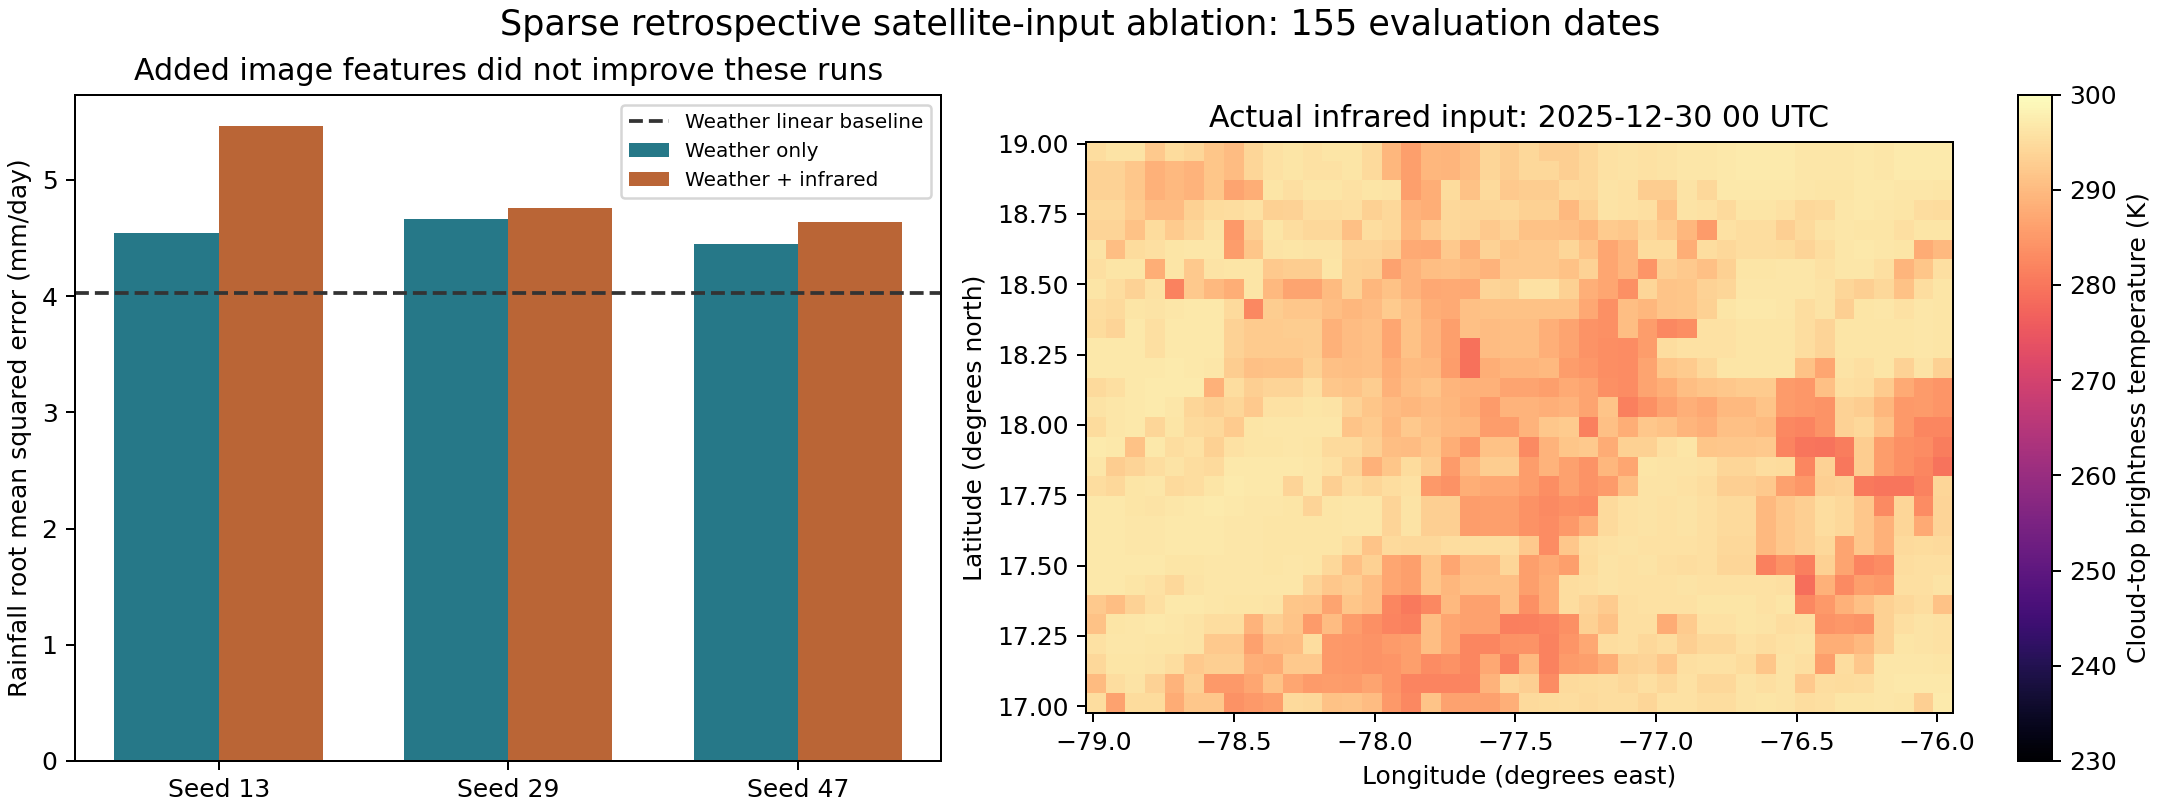
These are pooled infrared features, not a convolutional image model. Sparse sampling, retrospective availability, calibration transitions and additional parameters limit attribution. All satellite-ablation results.
Simulated impacts
Separate from rainfall forecasting. Crop and flood scenarios require their own assumptions and field validation. No damage, yield or inundation prediction is produced by this dashboard.
Terms explained
Select a term to read its meaning in this study.
climatology
The usual weather for a place and time of year, calculated from a chosen historical period.
hindcast
A prediction-style test using past data. It is not automatically proof that the same inputs were available in real time.
reanalysis
A weather model combined with historical observations to estimate past conditions on a grid.
baseline
A simple comparison method that a more complicated model should be tested against.
persistence
A baseline that assumes the next value will be the same as the latest known value.
root mean squared error
An error measure that squares each difference, averages those squares and takes the square root. Large mistakes count more heavily. Lower is better, but the score alone does not show every kind of failure.
mean absolute error
The average size of the mistakes, ignoring whether the model was too high or too low.
water vapour
Water in its gaseous form in the atmosphere.
moisture budget
An accounting of water entering, leaving and remaining within a chosen part of the atmosphere over time.
regularisation
An added training rule that discourages certain kinds of model behaviour. A rule can help some scores while hurting others.
physics-informed neural network
A neural network trained using information from a physical equation as well as other evidence. A physical penalty does not guarantee that its predictions are correct.
linear model
A model that combines its input features using fitted weights without hidden nonlinear layers.
infrared brightness temperature
A temperature-like value calculated from infrared radiation measured by a satellite. It can describe cloud tops or the surface seen through clear air; it is not a direct rainfall measurement.
training
The stage in which a model adjusts its parameters using designated examples.
validation
A separate set of examples used to choose settings without using the final evaluation results.
holdout
Data set aside for evaluation. Previously studied years are not a completely untouched scientific test.
recall
The fraction of reference cases of interest that a method successfully identifies. Here it describes how many heavy-rain days were detected.
bootstrap interval
An uncertainty estimate made by repeatedly resampling data. Its meaning depends on how the samples are chosen and which sources of uncertainty are included.
ablation
A comparison that changes or removes one part of a modelling pipeline to study its effect. Other differences, such as parameter count, can still complicate interpretation.
field validation
Checking model outputs against relevant independent observations collected in the real setting where the model would be used.