Introduction
A small error against reanalysis does not establish the same accuracy against a thermometer. We compared the frozen 2025 Barbados reconstruction with screened observations from Grantley Adams International Airport, using the Global Historical Climatology Network hourly product (GHCNh). The fixed local architecture and residual-calibration procedure are described in the related technical report listed in the references. No model weights, residual coefficients or selection decisions were changed after viewing these observations. The earlier reanalysis results remain valid for their stated target; the station comparison measures a different, more demanding discrepancy.
The airport is 15.01 km from the sampled reanalysis coordinate. Its catalogued elevation is 52.1 m, versus 7.72 m for the NASA POWER grid representation. The comparison therefore combines model error, reanalysis error and spatial representativeness differences. Station values at the exact hour are also instantaneous measurements, whereas POWER supplies hourly averages. We did not select a time shift to minimise error. This is a screened nearby-station comparison, not a collocated validation or an operational forecast assessment.
Data and methods: quality screening and matching
We checked station source hashes and the previously reviewed prediction hashes before comparison. For temperatures carrying source code 223, only quality code 1 was retained. For source 343, only codes 1 or 5 were accepted under the documented legacy rules. Missing, non-finite, suspect and unknown-quality values were excluded. These flags indicate acceptance by the source quality checks, not a guarantee of measurement accuracy.
The Barbados file contains 8,761 rows. Of these, 121 have rejected or unknown quality and 246 otherwise accepted records are not exactly on the hour. There are 8,394 unique accepted exact-hour records, of which 6,991 overlap the intermediate-hour predictions. No duplicate accepted exact-hour values required averaging. The temperature source identifiers include ICAO-TBPB and 789540-00408.
For Puerto Rico, the selected 2025 series from the queried RQ-prefixed archive subset is catalogued as Ponce 4E, 23.01 km from the sampled coordinate. Its temperature records identify ICAO-TJPS. Its 21.3 m elevation differs substantially from the grid’s 221.09 m. Most accepted observations occur at minutes 15, 35 and 55: only one exact-hour intermediate prediction matches. We do not report that single pair as a performance estimate or silently substitute an hourly aggregation. Closer Puerto Rican station files also exist but have not been evaluated here, so this is not an exhaustive station search. No Jamaican catalogued station lies within the exploratory 25 km search radius. The radius is a screening choice, not a validated representativeness threshold.
Results
The common evaluation set contains 6,991 intermediate hours in 2025. Every method is compared with the same observations. Both six-hour reanalysis endpoints are known inputs to the reconstruction models.
| Method | RMSE | MAE | Bias |
|---|---|---|---|
| Raw hourly POWER | 1.3970 | 1.1322 | +0.3165 |
| Linear interpolation | 1.4583 | 1.1920 | +0.3271 |
| Calendar comparator | 1.3942 | 1.1292 | +0.3157 |
| Local neural model | 1.4006 | 1.1361 | +0.3226 |
| Calibration policy | 1.4005 | 1.1361 | +0.3226 |
All errors are in degrees Celsius. RMSE is root-mean-square error; MAE is mean absolute error; bias is model minus observation. The calendar comparator has slightly lower station error than the neural model. The neural reconstruction improves on linear interpolation but does not improve on the original hourly reanalysis against this station. These point estimates do not establish statistical superiority.
Discussion
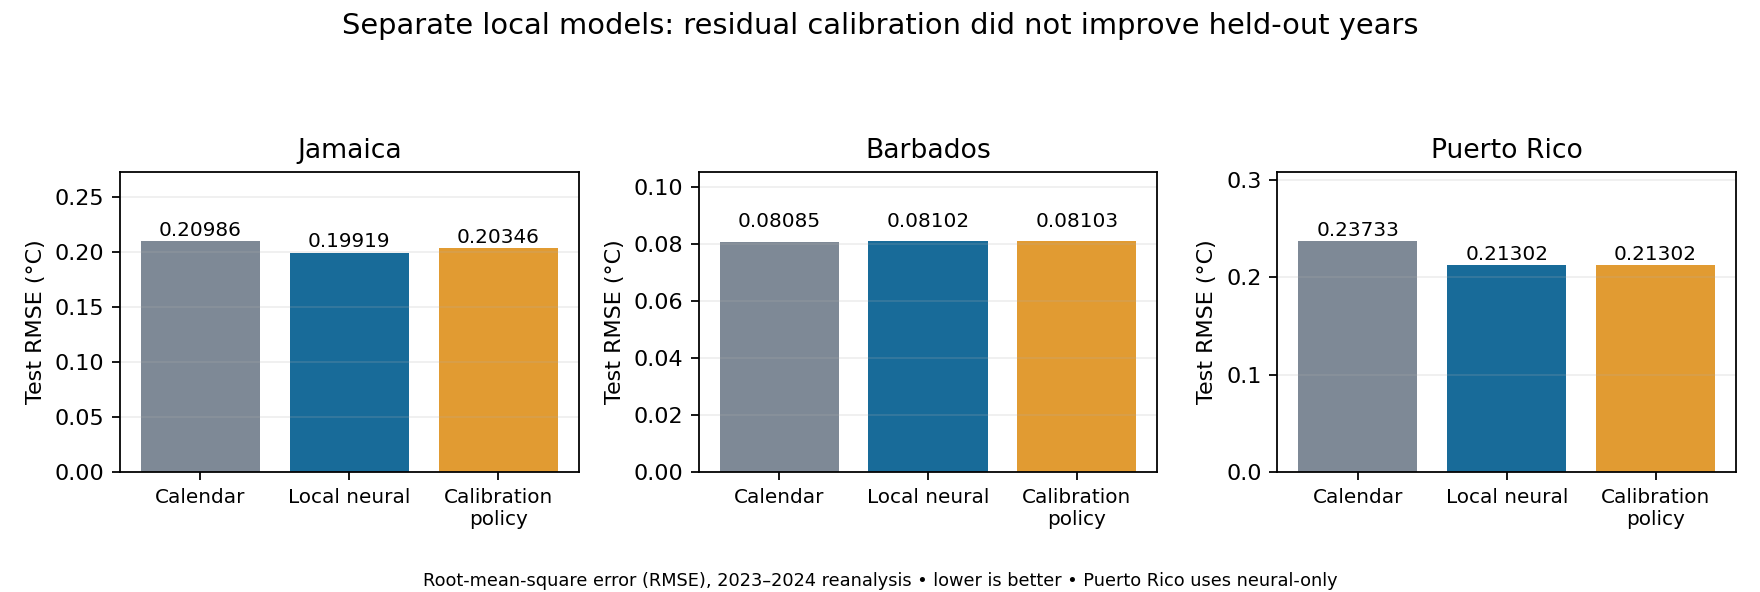
The local neural model’s previously reported 2025 Barbados reanalysis RMSE was 0.08208 degrees Celsius. Its station RMSE is 1.4006 degrees Celsius. These are not competing estimates of the same quantity. The first measures reconstruction of the gridded target; the second includes disagreement between that target and a nearby observing site. The residual correction does not resolve this gap.
Observational dependence
NASA’s MERRA-2 documentation states that only surface pressure from land-based surface meteorology stations is assimilated. This supports a distinction between the screened station temperatures and directly assimilated land-temperature inputs. It does not make the whole observing system independent: other atmospheric observations influence the reanalysis, and the grid and station share the same weather.
Limitations and future work
A stronger test requires more nearby stations, matched averaging periods, elevation and coastal-exposure checks, and coverage across seasons and extreme events. A separate, predefined aggregation study could use the off-hour Puerto Rico records, with its support mismatch and elevation difference retained. Forecast claims would additionally require archived forecasts and issue-time inputs. None of these checks is replaced by endpoint consistency, which is a mathematical constraint rather than an atmospheric conservation law.
Conclusion
The nearby-station comparison gives a different assessment from reanalysis reconstruction: the neural model improves on linear interpolation but not on the calendar comparator or original hourly POWER estimates. Calibration does not close this observational gap. Stronger accuracy claims require better spatial and temporal matching and broader observational coverage.
Data availability and references
The supporting evidence is retained privately: raw station files, request URLs and hashes, the station catalogue, quality documentation, the exact evaluator, coverage counts and matched arrays. No public archive of these analysis materials is currently provided. The official sources below provide public access to the underlying station data and documentation; they do not host this study’s code or matched evaluation arrays. Official sources accessed during this analysis:
GHCNh documentation, 10 March 2026, including source-specific quality rules.
NASA MERRA-2 FAQ, surface meteorology assimilation and screen-level comparisons.
Adrian Dunkley (2026). Local Endpoint-Constrained Residual Calibration: A three-location temperature test. Related technical report. Canonical paper page.