Introduction
Evaluation on an additional year tests whether a fitted reconstruction remains useful beyond the years used during development. This supplement asks whether the frozen local networks and their validation-selected calibration policies retain their performance in 2025. It extends the local-calibration experiment rather than introducing a separate modelling method. The comparison preserves the original selection decisions, including rejection of an unhelpful correction.
Data and methods
After developing the local reconstruction models, their selected weights, residual coefficients and validation-based adoption decisions were frozen in a local hash manifest. We then retrieved 2025 hourly temperatures for the same three coordinates from NASA POWER. No model was refitted, and no seed, checkpoint, penalty or correction was selected using 2025. The local manifest is reproducibility evidence, not externally timestamped preregistration.
Each series contains 8,760 source hours in Coordinated Universal Time, with Celsius units and MERRA-2 identified as the source. The five intermediate hours of the last interval are excluded because its later endpoint is outside the year, leaving 7,295 evaluation records per location. Source hashes, calendars, units and finite values are checked. Both six-hour endpoints remain known inputs: this is further-year reanalysis reconstruction, not issue-time forecasting or station validation. The earlier 2023–2024 results remain unchanged.
Results
| Location | Linear | Calendar | Local neural | Calibration policy |
|---|---|---|---|---|
| Jamaica | 0.59050 | 0.20303 | 0.19899 | 0.20045 |
| Barbados | 0.12763 | 0.08313 | 0.08208 | 0.08207 |
| Puerto Rico | 0.65871 | 0.22627 | 0.19727 | 0.19727 |
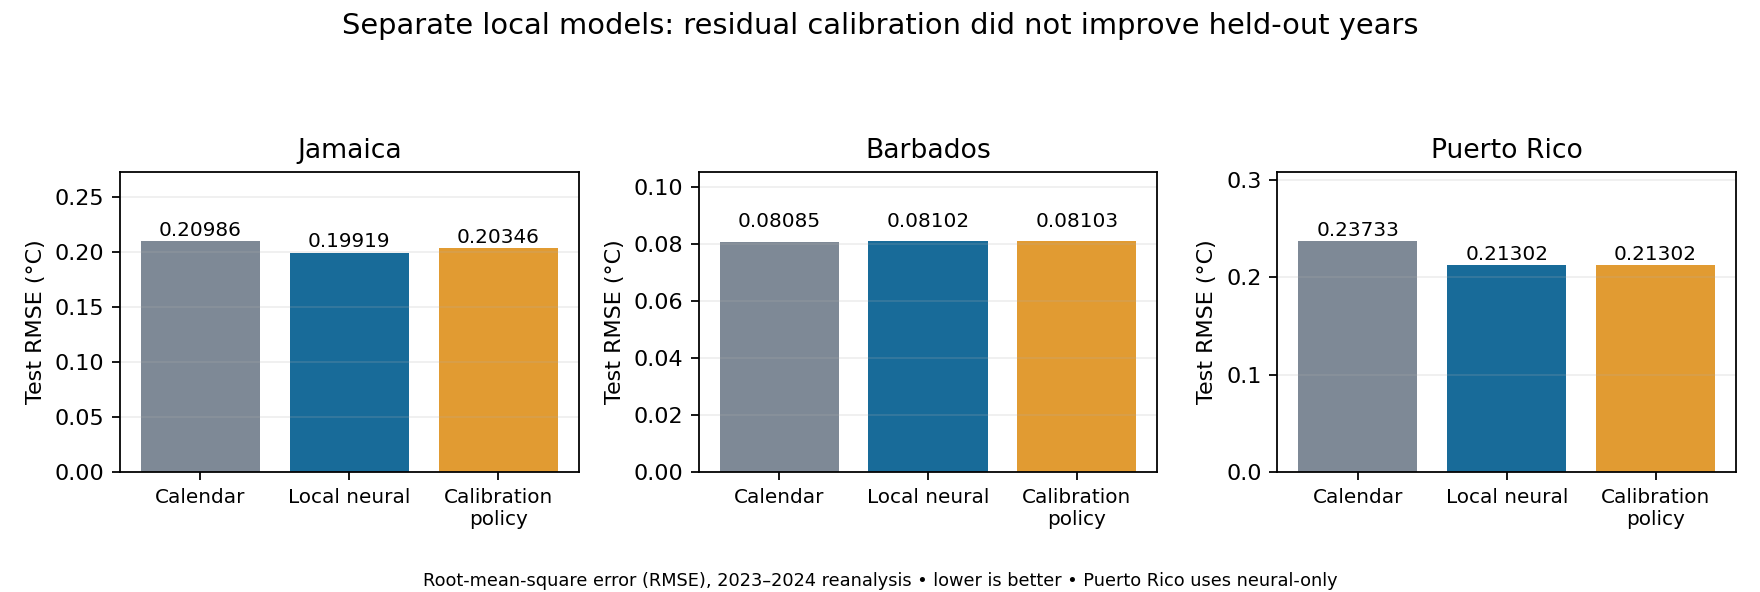
The separate local neural models have lower errors than the fixed calendar at all three sample points in 2025. The residual equation still worsens Jamaica, changes Barbados by only about 0.00001 degrees Celsius, and is not adopted for Puerto Rico because of the earlier validation decision. No claim of statistically established superiority follows from this table alone. Mean absolute error and bias are retained in the machine-readable results.
Discussion
This further-year check supports the usefulness of locally fitted neural reconstruction in this limited setting. It does not show a universal physical correction or geographic transfer: all three locations contributed their own historical training data. Reanalysis errors, one-point-per-island coverage and the absence of independent stations remain material limitations. The result is consistent with retaining the local neural models while treating residual equations as hypotheses to test, not discovered conservation laws.
Limitations and future work
The test uses one coordinate per island and known later endpoints. It does not evaluate forecast inputs available at an earlier issue time, an unseen island or independent thermometer measurements. Future tests should separate station representativeness from reconstruction error and preserve a frozen protocol when adding locations, events or issued forecasts. The local hash record establishes file integrity, not independent certification of experimental timing.
Conclusion
The frozen networks outperform the specified calendar comparator at the three sampled points in 2025. The residual equation still provides no consistent improvement. Further-year agreement with reanalysis supports continued methodological evaluation but does not remove the need for observational and forecast-specific tests.
Data availability and references
The frozen-file manifest, three raw 2025 responses, exact request URLs and source hashes, evaluator, predictions and all metrics are retained privately. No public analysis archive is currently provided. Source: NASA POWER Hourly API documentation. The fixed architecture, residual equation and earlier tests are reported in the related technical study listed below.
Adrian Dunkley (2026). Local Endpoint-Constrained Residual Calibration: A three-location temperature test. Related technical report. Canonical paper page.