1. Research question and scope
How does the satellite aerosol record vary across Jamaica and through the year, and how does the June 2020 event compare with a preceding June? This study was submitted to the Inter-American Institute for Global Change Research course on 31 March 2026 under the title “Godzilla from Space: Watching Saharan Dust Invade Jamaica Using 24 Years of Satellite Data”. The stated analysis period, 2001–2023, spans 23 calendar years. That period is used here to describe the evidence.
The study links three views of the same problem: a map of aerosol loading over Jamaica, a time series of island-level summaries and a wide-Atlantic view of aerosol movement. These products provide context for a dust event. They do not, by themselves, attribute every aerosol observation to mineral dust or measure exposure at ground level.
2. Data and method
Aerosol optical depth and terrain
The analysis uses the MODIS MAIAC aerosol optical depth product at a nominal grid spacing of 1 km. Aerosol optical depth is dimensionless: it describes attenuation through the atmospheric column. The mapped mean aerosol field is displayed over SRTM terrain hillshade to make the relationship between the aerosol pattern and island terrain visible. Hillshade adds topographic context; it does not provide a vertical dust profile.
Temporal comparisons
The project summarises annual mean aerosol optical depth and June–August dust-season means. It also compares the June 2019 and June 2020 composites. The same descriptive summaries are used to identify the magnitude of the 2020 departure. The report does not provide confidence intervals, retrieval counts for each composite or a sensitivity analysis for cloud-related missingness. Those quantities would be needed to assess how sampling affects the comparison.
Atlantic context
Sentinel-5P ultraviolet aerosol-index imagery supplies a wider view across the Atlantic. Its role is to show the plume’s spatial context and movement toward the Caribbean. The ultraviolet aerosol index and MODIS aerosol optical depth are separate quantities and should not be merged onto one numerical scale.
3. Results
| Summary reported in the project | Value |
|---|---|
| Annual mean aerosol optical depth | 0.11–0.14 |
| June–August mean aerosol optical depth | 0.145–0.226 |
| June 2019 mean aerosol optical depth | 0.178 |
| June 2020 mean aerosol optical depth | 0.294 |
| Relative June increase, calculated from the reported means | 65.2% |
The relative increase is calculated as (0.294 − 0.178) / 0.178 × 100. It is a comparison of two monthly means, not a confidence bound or an estimate of the change in surface particulate matter. The original map shows lower retrieved aerosol loading over the Blue Mountains than over coastal lowlands. Terrain, retrieval conditions and sampling may each contribute to that pattern; this project does not separate their effects.
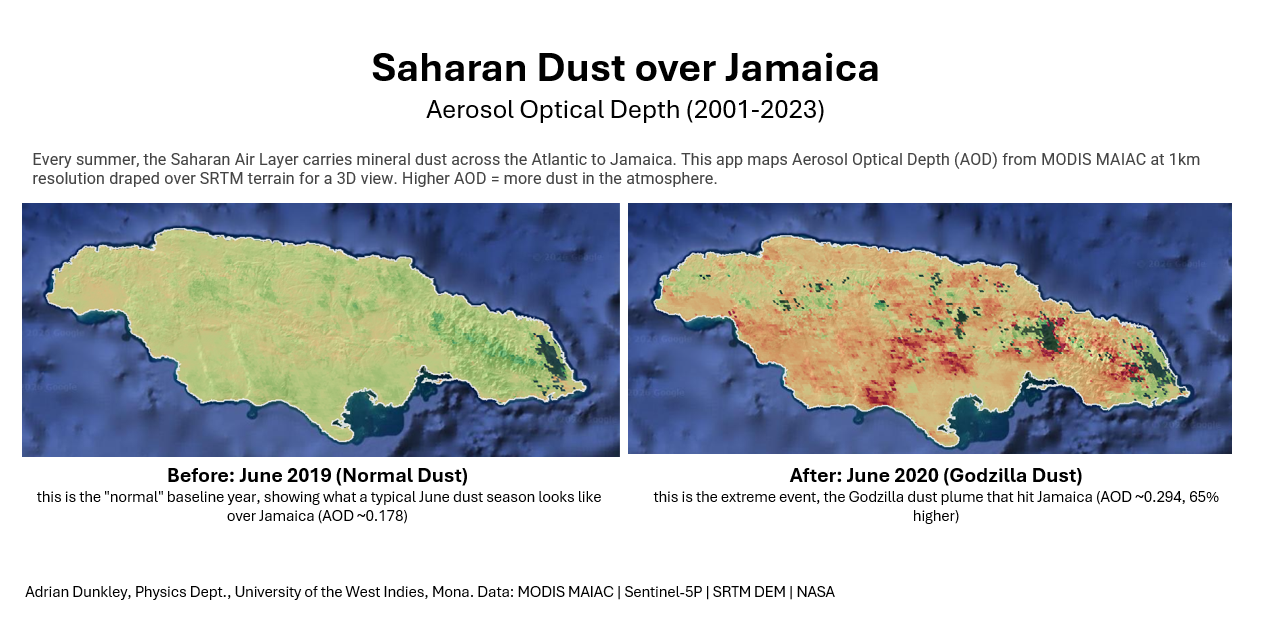
Figure 1. The original paired maps and their source annotation. The 2020 field has higher aerosol loading. The map is a satellite-column comparison, not a surface air-quality measurement.
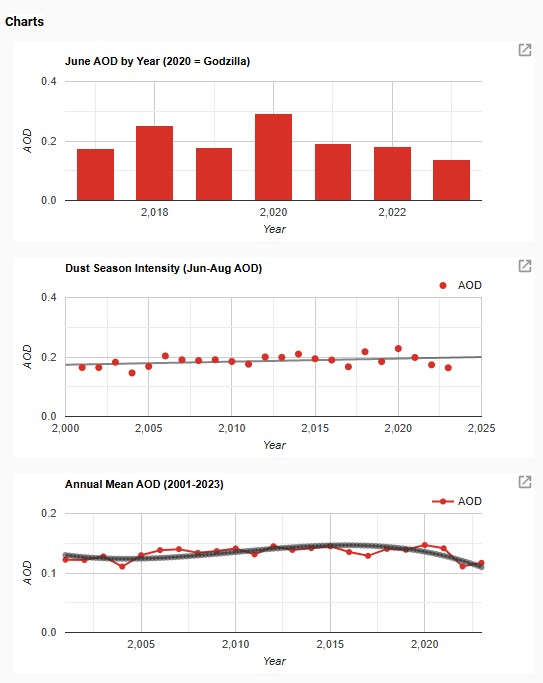
Figure 2. Time-series charts retained from the submitted analysis. Source: Adrian Dunkley’s MODIS MAIAC project, 31 March 2026.
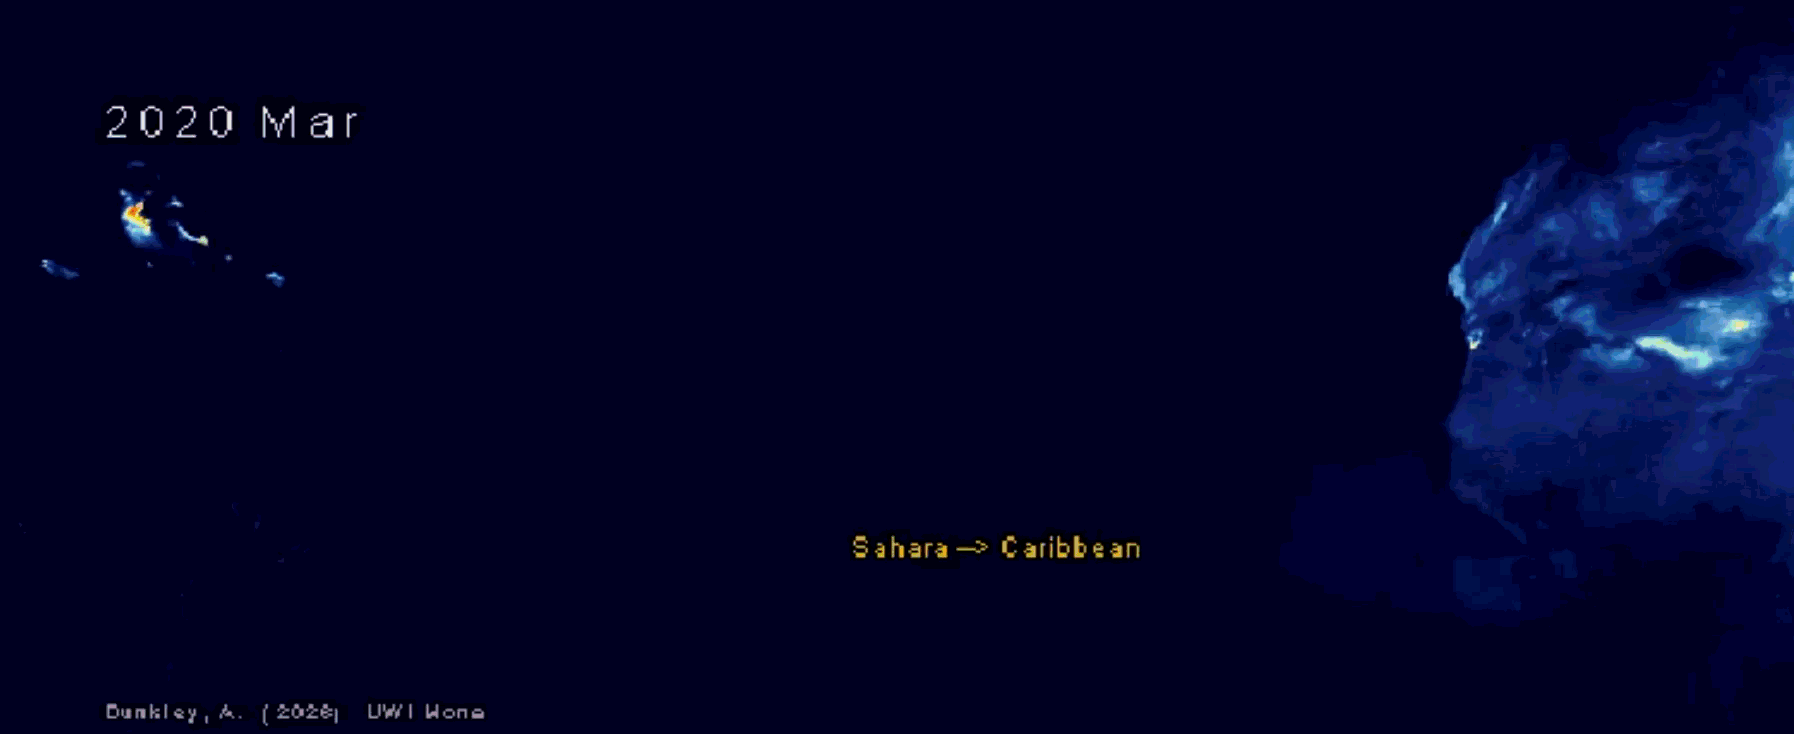
Figure 3. An original frame from the Atlantic aerosol animation. The source PDF contains this static frame; it does not contain the full time sequence.
4. Interpretation and proposed follow-up
The seasonal summaries support examining June–August separately from annual averages. An annual mean can hide a short period of much higher aerosol loading. The paired June maps also show why an event comparison needs a consistent spatial domain and compositing procedure.
The original project proposed exploring aerosol optical depth values of 0.22 and 0.30 as warning indicators. These values have not been calibrated against surface monitors, exposure measurements or health outcomes. They are recorded as research proposals, not operational alert thresholds. A useful next study would match satellite retrievals to independent surface measurements, document missing-data behaviour and evaluate false alarms and missed events before choosing a decision threshold.
5. Limitations and relationship to the thesis
This is a descriptive satellite analysis. It does not establish a trend’s statistical significance, the causes of a spatial contrast, a direct aerosol-to-health relationship or predictive skill. The original source does not specify every quality-control setting or the exact collection revision. The accompanying Earth Engine code is the appropriate starting point for reproducing those choices.
The thesis connection is methodological: spatial support, terrain, missing retrievals and the difference between a measured column quantity and a near-surface variable all matter when satellite products constrain a local atmospheric model. The project supplies experience with those issues. It is not evidence that D-LEGOS has reconstructed three-dimensional dust transport.
References and source record
- Dunkley, A. (2026). Godzilla from Space: Watching Saharan Dust Invade Jamaica Using 24 Years of Satellite Data. IAI course submission, 31 March. The source narrative and scientific figures are reproduced and developed on this page; course-interface material and other participants’ comments are excluded.
- Original Earth Engine analysis code.
- Original interactive aerosol map.