1. Study question and domain
The question is how forest loss accumulated within a defined area of Rondônia and whether the Landsat vegetation record distinguishes pixels classified as lost forest from those classified as intact forest. Adrian Dunkley submitted the study to the Inter-American Institute for Global Change Research course on 30 March 2026 as “Watching the Amazon Disappear: 23 Years of Forest Loss in 2 Seconds”.
The study area is approximately 398 km². Its boundaries define every area total and percentage below. These quantities describe that selected region, not the Amazon as a whole. The annual forest-loss charts cover 2001–2023; the Landsat vegetation plots include observations beginning in 2000.
2. Data and analytical approach
Forest-change accounting
Hansen Global Forest Change provides the forest-change layers used in the original analysis. The workflow groups pixels by reported loss year, calculates annual loss area and accumulates those areas across the period. A histogram identifies years with more clearing, while the cumulative curve shows how repeated annual losses add up.
The project also extracts a forest-gain area. The product’s gain layer covers 2000–2012, whereas the extended annual loss record continues through 2023 [2]. Subtracting these quantities does not produce a like-for-like net change over 2001–2023. The original subtraction, 2,698 minus 306 equals 2,392 hectares, is therefore retained only in the source record and is not used as the study’s net-loss result.
Vegetation-index comparison
Landsat observations supply a normalised difference vegetation index (NDVI) time series. The original analysis compares pixels classified as lost forest with intact-forest pixels, shows annual mean NDVI for the region and plots all available vegetation observations with fitted trend lines. The charts retain their original dates, axes and labels. No new trend coefficients, significance tests or uncertainty intervals have been fitted for this page.
Visual sequence
The project includes an annual map sequence intended to show changes in vegetation and canopy continuity. The submitted PDF preserves one map frame. That frame is reproduced below without inventing missing animation frames. The accompanying Earth Engine code records the original workflow.
3. Reported results
| Quantity | Source-reported value | Interpretation |
|---|---|---|
| Study area | Approximately 398 km² | Selected Rondônia region |
| Forest-loss area | 2,698 ha | Loss over the study’s annual record |
| Loss as a fraction of the region | 6.78% | Rounded percentage in the submission |
| Largest annual loss | Approximately 500 ha in 2002 | Read from the reported annual comparison |
| Forest-gain area | 306 ha | Gain layer with a different time window |
The annual loss histogram peaks early in the record, declines through the mid-2000s and shows a later increase. The cumulative-loss curve continues to rise because it adds reported losses rather than subtracting subsequent regrowth. The source describes lower vegetation-index values among forest-loss pixels than among intact-forest pixels, although the individual observations overlap and vary through time.
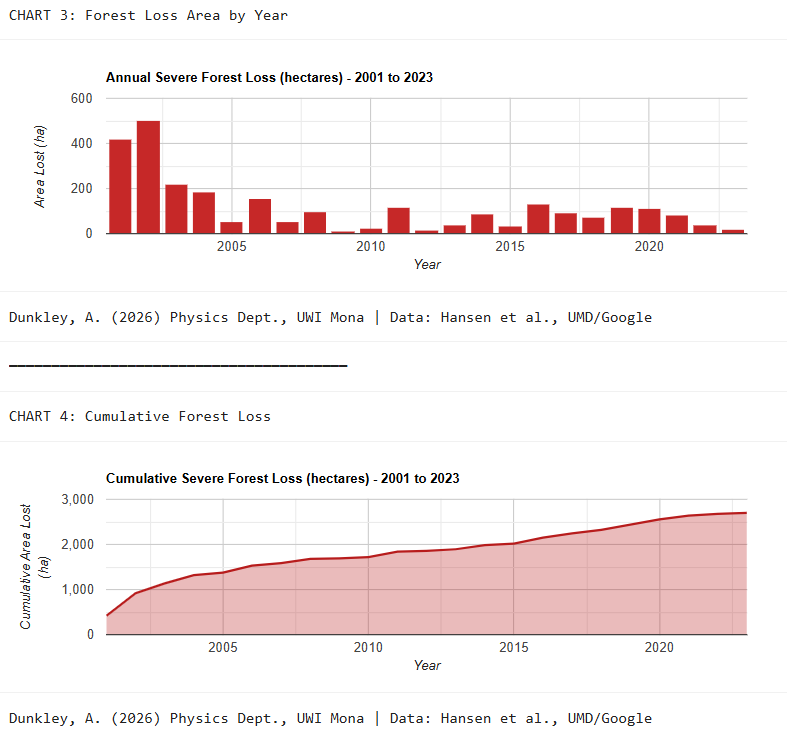
Figure 1. Original annual and cumulative loss charts. Areas are in hectares and the loss-year axis covers 2001–2023. Source: Adrian Dunkley’s IAI submission.
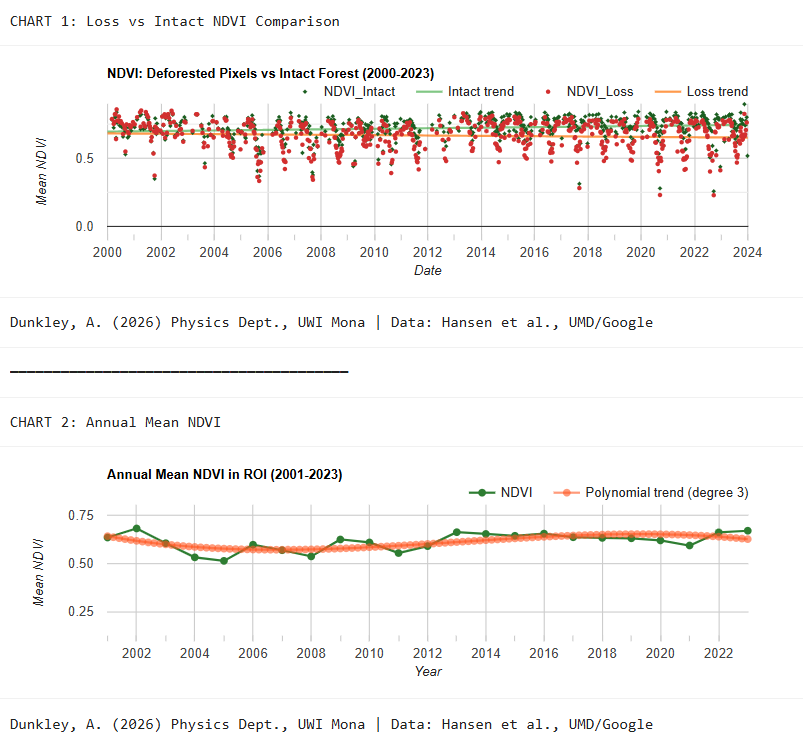
Figure 2. Original vegetation-index comparisons. NDVI is dimensionless. The fitted lines describe these observations; they do not identify a cause of land-cover change.
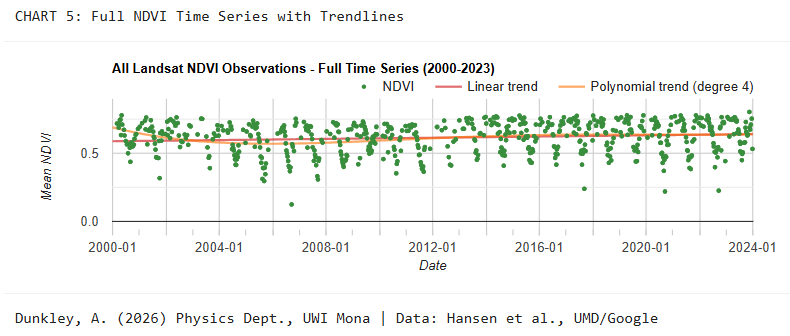
Figure 3. Full vegetation-index series retained from the submitted project.
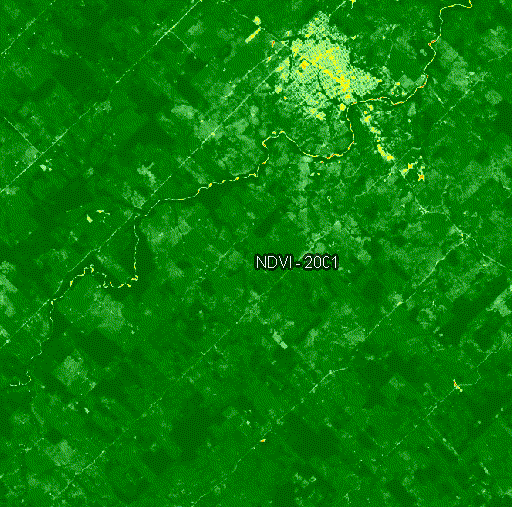
Figure 4. Static 2001 frame from the original visual sequence. The PDF source does not preserve the full animated sequence.
4. Discussion
The analysis shows the value of reporting annual and cumulative change together. A cumulative total gives the scale of recorded loss but hides when it occurred. The annual chart reveals concentrations of loss that can guide further investigation. The vegetation plots provide a second view of land-surface change, although NDVI alone does not measure forest age, species composition or carbon stocks.
The original submission suggested that enforcement, legal changes and road access might explain parts of the time pattern. Those are hypotheses for follow-up, not causal findings from these charts. Testing them would require spatially and temporally matched information about interventions, access and land use, together with a design that addresses competing explanations.
5. Limitations and thesis connection
The report does not provide an independent classification-accuracy assessment, uncertainty bounds for the area totals or a complete account of cloud filtering and valid-observation counts. The exact area boundary and forest-definition settings should be recovered from the original code when reproducing the analysis. Tree-cover loss is not automatically equivalent to permanent land-use conversion; gain and loss also have different temporal support in the cited product.
For the climate-physics programme, the relevant experience is the construction and interpretation of geospatial time series. Land-surface data can inform a reconstruction only when its spatial support, dates, missing observations and physical meaning are preserved. This study demonstrates a mapping workflow and supplies contextual surface-change evidence. It does not establish the performance of an atmospheric model.
References and source record
- Dunkley, A. (2026). Watching the Amazon Disappear: 23 Years of Forest Loss in 2 Seconds. IAI course submission, 30 March. Scientific figures and reported quantities are retained on this page; course-interface material and other participants’ comments are excluded. Original Earth Engine code.
- Hansen Global Forest Change v1.11, 2000–2023: official dataset description and band periods. The gain band covers 2000–2012; the loss-year band extends through 2023.
- Hansen, M. C., et al. (2013). High-resolution global maps of 21st-century forest cover change. Science, 342, 850–853. doi:10.1126/science.1244693.