1 Introduction and purpose
This pilot examines a decision component for a climate-oriented PhD workflow: estimating when a fixed one-day temperature forecast is likely to have a large error. The setting is one NASA POWER grid-cell location near Kingston, Jamaica. A compact model receives a short summary of past weather and forecast diagnostics, then assigns probabilities to two error-risk categories. The numerical forecast and the risk assessment have separate roles. The forecast estimates temperature. The gate estimates a property of its subsequent error.
Laya is a public model family for typed decisions over a supplied state. This experiment uses its approximately 322-million-parameter multilingual checkpoint with Python package version 0.4.1 [4,5]. A fixed task prompt and held-out probability recalibration adapt that checkpoint to the present problem. No model weights are trained or fine-tuned. The scientific contribution is a reproducible case study of this bounded adaptation, including comparison with simpler numeric baselines and explicit failure analysis. It does not establish novelty for Laya itself.
The model card cautions that multilingual Laya is uncalibrated out of the box and weaker on English than the separate English checkpoint [5]. These warnings make probability evaluation and answer-order robustness essential. A high-confidence answer, high majority-class accuracy, or successful model execution would not by itself show a useful gate. Proper scoring rules provide a way to evaluate the quality of probabilities [6]. Calibration has an established role in neural-network evaluation [7], but its benefit here must be measured on held-out climate data.
2 Hypotheses and protocol status
The original local protocol fixed three hypotheses before the climate-card inference runs. H1: calibrated Laya has lower test Brier score than a constant probability estimated from calibration-period event prevalence. H2: calibrated Laya has lower test Brier score than a recalibrated numeric logistic gate. H3: reversing answer-option order changes at most 5% of raw argmax decisions. The primary event is an absolute frozen-ridge error strictly greater than 1.0°C. For H1 and H2, the planned criterion for advantage is a paired month-cluster bootstrap 95% interval entirely below zero for the Laya-minus-comparator Brier difference.
The protocol is a timestamped and hashed local analysis freeze from 8 October 2026, rather than an externally registered study. Initial data inspection covered endpoint feasibility and schema. The experiment subsequently revealed only one primary event among 156 calibration Mondays and one among 209 test Mondays. The primary analysis remains preserved and is reported as severely underpowered.
After learning that the primary event was sparse, an explicitly exploratory amendment defined a second event threshold as the empirical 90th percentile of the frozen ridge model’s absolute errors on 2011–2018 gate-training dates. The resulting threshold is 0.49867850535°C, computed from 2,922 training rows. The amendment was frozen before calculating its calibration and test metrics and before Laya inference. It changes the threshold in the otherwise fixed question and retrains only the numeric risk baseline for the new labels. Because observed primary outcomes motivated the amendment, secondary results are exploratory and cannot replace the primary endpoint or be described as confirmatory.
3 Data and temporal design
The public NASA POWER daily API supplied 9,131 daily records from 1 January 2001 through 31 December 2025 at requested latitude 18.0° N and longitude 76.8° W. The requested fields are daily mean, maximum and minimum two-metre temperature (T2M, T2M_MAX and T2M_MIN), corrected precipitation (PRECTOTCORR), two-metre relative humidity (RH2M), and two-metre wind speed (WS2M). The requests use Local Solar Time. The returned series has no missing values in these six fields. NASA documents the native MERRA-2 meteorological grid as 0.5° latitude by 0.625° longitude [1–3]. The target is a gridded surrogate at the requested location, rather than independent station truth.
| Period | Role | Days or evaluation set |
|---|---|---|
| 2001–2010 | Fit numerical forecast | Daily |
| 2011–2018 | Fit numeric risk gate | 2,922 daily rows |
| 2019–2021 | Calibrate probabilities | 156 Mondays |
| 2022–2025 | Held-out test | 209 Mondays |
All Mondays in calibration and test define the common Laya evaluation dates, chosen by calendar rather than by outcome. Daily numerical-baseline results provide context, but cross-model conclusions use the same Monday subset. The calibration and test years are disjoint from both earlier fitting periods. A forecast at target date t uses weather observations only through t−1 and the known target-day calendar.
This retrospective pseudo-operational hindcast enforces event-time causality. It does not reconstruct the reporting delays, provisional products or subsequent revisions that a real-time system would encounter. NASA notes that recent meteorology can use a lower-latency source and later updates [1]. Even the lower-latency meteorological product is generally about two days behind real time [1]. Finalized t−1 inputs used here would therefore not generally be available for an actual next-day decision. The completed historical series cannot establish deployable next-day performance. Archived data vintages and explicit availability-time rules would be required for that claim.
4 Methods
4.1 Numerical forecasts and event labels
The persistence forecast equals the previous day’s mean temperature. Harmonic climatology uses an intercept plus annual and semiannual sine and cosine terms, fitted by ordinary least squares on 2001–2010. The ridge forecast uses a median-imputation and standardization pipeline with Ridge(alpha=10), fitted on that same period and never refitted. Its 16 predictors are four calendar harmonics, mean-temperature lags of 1, 2, 3 and 7 days, the previous day’s maximum and minimum temperature, precipitation, humidity and wind, the previous seven-day mean and sample standard deviation of temperature, and previous seven-day mean rainfall.
eₜ = |Tₜ − T̂ₜ,ridge|, yₜ(τ) = 1[eₜ > τ]
The primary threshold τ is 1.0°C. The exploratory threshold is the training-error 90th percentile given above. Equality at either threshold belongs to the low-error class. These labels concern error magnitude in daily mean temperature. They do not identify dangerous heat, social vulnerability or an impact-specific warning threshold. Because the numerical model was fitted only before 2011, gate-training labels are out of sample relative to that numerical model.
4.2 Numeric features and textual evidence cards
The risk gate uses twelve fields: previous-day temperature anomaly relative to harmonic climatology for that day, the latest daily temperature change, previous seven-day temperature standard deviation, previous seven-day ridge mean absolute error, previous-day humidity, rainfall and wind speed, the target forecast minus persistence, and four target-day seasonal harmonics. The recent-error feature is shifted by one day before the seven-day rolling mean, so it only includes already completed forecast outcomes. The first seven gate-training days can include residual history from the earlier numerical-fit period. No target label in gate training comes from that period.
The first eight diagnostic fields are rounded to three decimals and the harmonic fields to six decimals for the risk-model comparison. Deterministic English cards give the numeric values and low, typical or high descriptors based on fixed lower and upper tertiles. Descriptors use the 2001–2010 numerical-fit period. Numeric logistic and Laya receive the corresponding quantized evidence. Cards have a maximum of 63 whitespace-separated words, below the 180-word protocol limit. Dates are metadata only. The text contains no target-day temperature, realized error or event label.
4.3 Frozen Laya inference and probability recalibration
The checkpoint is convaiinnovations/laya-multilingual at revision 1720e3e3357cfe1e281542e223f8273b0890ca34. Public source and checkpoint metadata specify Apache 2.0 licensing [4,5]. The model card describes an mmBERT-base encoder with a typed-decision head and approximately 322 million total parameters. This experiment uses English cards and explicitly selects that checkpoint. It measures neither multilingual transfer nor the separate English model.
The primary choice instruction asks the model, using only historical weather and model diagnostics, to classify the risk that tomorrow’s ridge temperature forecast has an absolute error greater than 1 degree Celsius. Option A describes error at most the threshold and option B describes error greater than the threshold. The canonical A,B order is the primary predictor. Every calibration and test card is also scored in B,A order without changing key meanings. Reversed-order scores measure robustness and are never selected as an alternative predictor based on test performance. The exploratory prompt displays its threshold rounded to six decimal places, while event labels use the full numerical threshold.
For each endpoint, logistic recalibration fits an intercept and slope to the clipped logit of canonical Laya probability using only the 156 calibration Mondays. The implementation uses LogisticRegression(C=1, solver=lbfgs, max_iter=1000). The numeric logistic gate receives the same one-dimensional recalibration procedure on its own probabilities. This is regularized logistic recalibration, not temperature scaling and not a model-weight fine-tune. With a free slope, recalibration can reverse a score’s ranking. Any such reversal must be interpreted as a learned score mapping, rather than evidence that the original confidence was calibrated.
4.4 Risk baselines and evaluation
The numeric logistic risk baseline uses train-only median imputation, standardization, LogisticRegression(C=1, max_iter=2000, class_weight=None), and random seed 20261008. It is fitted on 2011–2018 labels, separately for each endpoint. Constant comparators use training-period or calibration-period prevalence as labeled. The primary hypothesis comparator is calibration prevalence. The recent-error comparator is the previous seven resolved event counts plus one, divided by nine. This smoothed empirical fraction uses the same endpoint threshold and only earlier outcomes.
Forecast metrics are mean absolute error (MAE), root mean squared error (RMSE) and signed bias. Gate metrics include Brier score, log loss, AUROC, average precision, ten-equal-width-bin expected calibration error, macro F1 and false-negative rate. A fixed probability threshold of 0.5 is supplemented by each method’s maximum-F1 threshold selected only on calibration data. The nominal 80% acceptance experiment retains test cases with risk below the calibration-period acceptance quantile and reports realized coverage, retained-set MAE and event rate. Ties and distribution shift mean that test coverage need not equal 80%.
Brier = mean[(pₜ − yₜ)²]
Paired Brier differences use 2,000 bootstrap replicates that resample calendar-month clusters, with random seed 20261008 and percentile 95% intervals. Resampling keeps paired predictions and outcomes together within sampled months. The bootstrap does not refit the numerical forecast, risk models or recalibration mappings. It conditions on those fits and excludes training and calibration-fit uncertainty. The interval procedure is approximate under serial dependence and a four-year test window. For the primary endpoint, one test event makes any seemingly precise estimate particularly fragile. An interval that excludes zero cannot compensate for inadequate event support or establish regional generalization.
Leakage tests check disjoint split dates, lagged weather features, shifted residual history, cards without outcome fields, and invariant predictions and cards when future observations are perturbed or truncated. Reproducibility checks refit the pipeline and compare predictions and card bytes with saved outputs. Model pretraining is outside this controlled temporal split. Unknown overlap between Laya’s pretraining material and the evaluation era cannot be excluded, although cards omit dates, years and future outcomes.
5 Results
5.1 Data checks and numerical forecast accuracy
All implemented causal and reproducibility checks passed. Future-weather perturbations at cutoffs in July 2019 and July 2022 left predictions, gate features and cards through the respective cutoffs unchanged. Future-row truncation preserved predictions to numerical tolerance and preserved card bytes. Serialized and refitted numerical models reproduced saved outputs. These checks support the implemented event-time separation; they do not resolve source-data latency or possible language-model pretraining overlap.
| Test dates | Forecast | n | MAE °C | RMSE °C | Bias °C |
|---|---|---|---|---|---|
| All days | Persistence | 1461 | 0.267 | 0.352 | 0.000 |
| All days | Climatology | 1461 | 0.799 | 0.929 | -0.727 |
| All days | Ridge | 1461 | 0.263 | 0.342 | -0.103 |
| Mondays | Persistence | 209 | 0.258 | 0.323 | -0.053 |
| Mondays | Climatology | 209 | 0.818 | 0.953 | -0.743 |
| Mondays | Ridge | 209 | 0.270 | 0.338 | -0.142 |
On all 1,461 test days, ridge MAE was 0.263°C, compared with 0.267°C for persistence. On the 209 common test Mondays, persistence had lower MAE (0.258°C) than ridge (0.270°C). The risk experiment nevertheless retains the prespecified ridge forecast and its error labels. Selecting the better Monday forecaster after test inspection would change the experiment. The old harmonic climatology has a substantial negative bias and provides a limited frozen seasonal reference.
5.2 Primary endpoint with one test event
The primary error threshold exceeded 1°C on 1 of 156 calibration Mondays (0.64%) and 1 of 209 test Mondays (0.48%). An always-low classifier would therefore be correct on 208 of 209 test dates (99.52%). The corresponding daily test series contains 16 events among 1,461 days, underscoring the loss of event support in the fixed weekly subset.
| Method | Brier | AUROC | AP | Log loss |
|---|---|---|---|---|
| Calibration constant | 0.004764 | 0.500 | 0.005 | 0.0306 |
| Recent-error rule | 0.019375 | 0.471 | 0.005 | 0.1383 |
| Numeric logistic raw | 0.006796 | 0.986 | 0.250 | 0.0273 |
| Numeric logistic calibrated | 0.005484 | 0.986 | 0.250 | 0.0242 |
| Laya raw | 0.399632 | 0.575 | 0.011 | 1.0047 |
| Laya calibrated | 0.004764 | 0.575 | 0.011 | 0.0305 |
The primary calibrated-Laya Brier difference was -3.54e-07 (95% interval -1.64e-06 to 1.45e-06) against the calibration constant and -0.00072 (95% interval -0.00246 to 0.00024) against calibrated numeric logistic. These conditional intervals and single-event ranking metrics cannot establish calibrated population probabilities or a robust advantage. The primary outcome remains inconclusive because the event support is inadequate.
Raw Laya chooses the high-error option on every calibration and test card for both endpoints. Primary test probabilities span 0.5351–0.7691 despite an observed event frequency of 0.48%. Recalibration sharply reduces the probability level, producing results close to the calibration-prevalence constant. Uniform raw high-error choices are not useful binary discrimination.
5.3 Exploratory training-quantile endpoint
The exploratory threshold of 0.49867850535°C gives 14 events among 156 calibration Mondays (8.97%) and 27 events among 209 test Mondays (12.92%). Table 4 reports all evaluated risk methods. Figure 1 separates the effect of recalibration from the comparison with a numeric baseline and a prevalence-only forecast.
| Method | Brier | AUROC | AP | Log loss |
|---|---|---|---|---|
| Calibration constant | 0.1141 | 0.500 | 0.129 | 0.3933 |
| Recent-error rule | 0.1203 | 0.618 | 0.207 | 0.4013 |
| Numeric logistic raw | 0.1098 | 0.673 | 0.242 | 0.3711 |
| Numeric logistic calibrated | 0.1108 | 0.673 | 0.242 | 0.3776 |
| Laya raw | 0.5486 | 0.500 | 0.140 | 1.3964 |
| Laya calibrated | 0.1142 | 0.500 | 0.136 | 0.3946 |
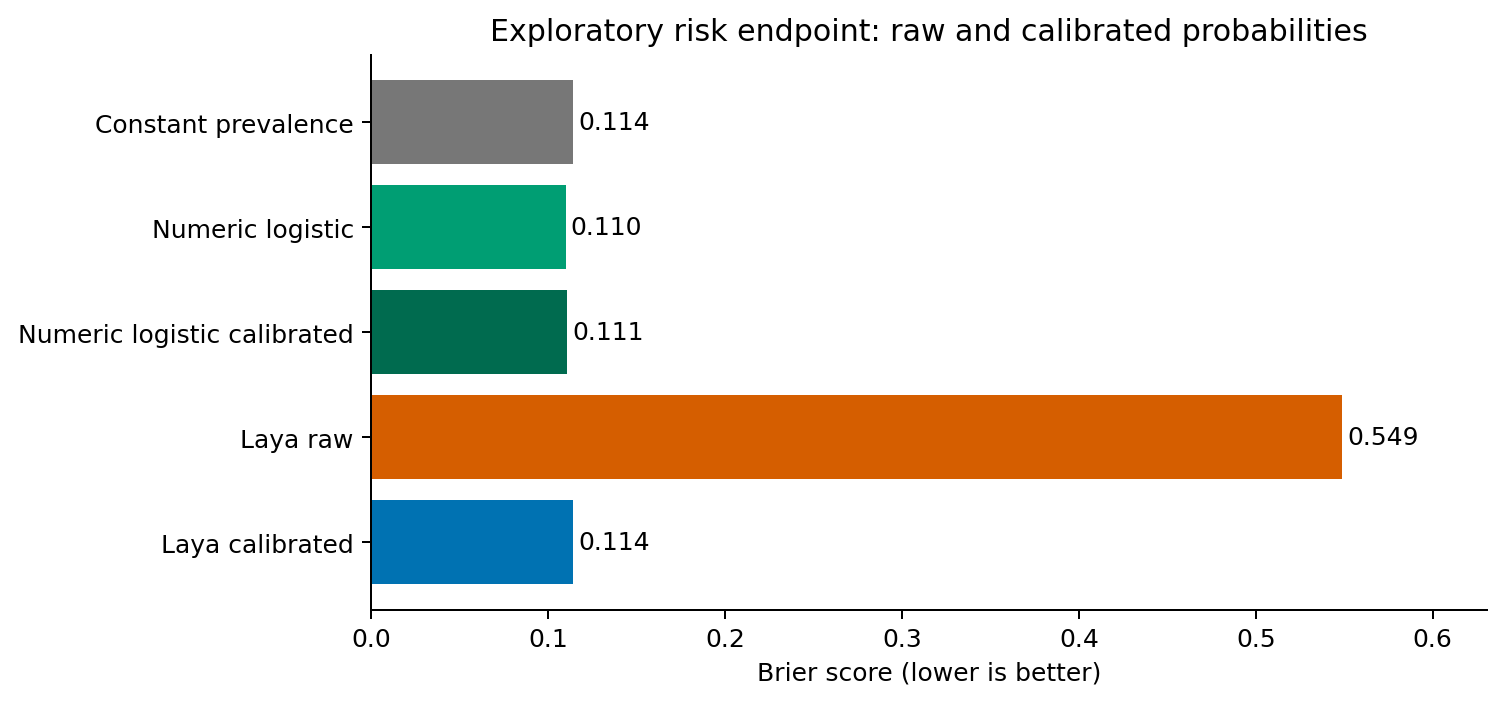
Figure 1. Exploratory held-out Brier scores. Raw and calibrated Laya and numeric logistic probabilities use the same 209 target dates. The constant uses calibration prevalence. Lower values are better.
Calibrated Laya Brier score was 0.1142, versus 0.1108 for calibrated numeric logistic and 0.1141 for the calibration constant. The paired Laya-minus-constant difference was 0.00013 (95% interval -0.00141 to 0.00157). The paired Laya-minus-numeric difference was 0.00338 (95% interval -0.00409 to 0.01222). These month-cluster intervals condition on fitted calibration mappings and omit calibration-fit and training uncertainty. The entire secondary analysis remains exploratory.
Laya AUROC was 0.500 before recalibration and 0.500 after recalibration. Its average precision changed from 0.140 to 0.136. Calibrated numeric logistic achieved AUROC 0.673 and average precision 0.242. The exploratory Laya recalibration slope was -0.9296; the fitted intercept was -1.0822.
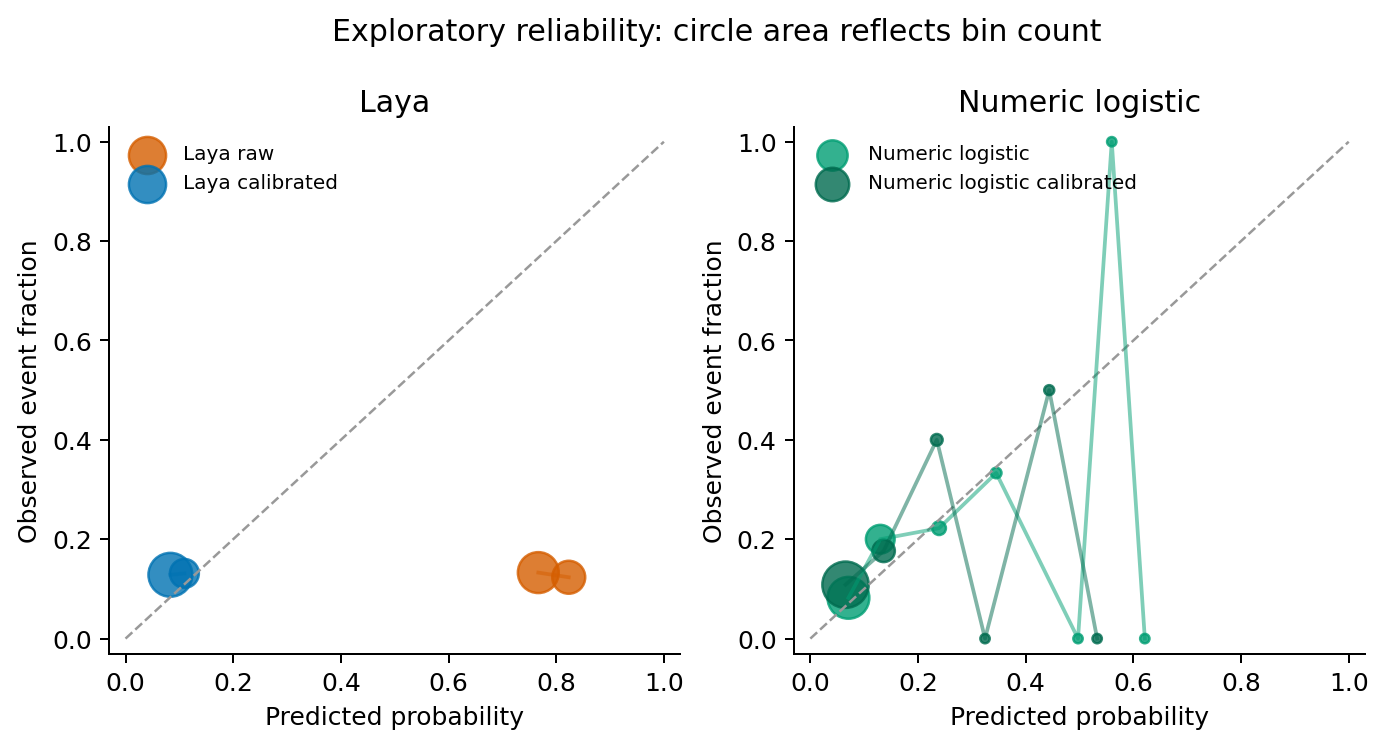
Figure 2. Exploratory reliability diagrams on the common test set. Points summarize nonempty equal-width probability bins; marker area increases with bin count. Sparse bins and only 27 total events limit interpretation.
5.4 Option order and retained forecasts
| Endpoint | Split | Flips | Flip rate | Mean |Δp| |
|---|---|---|---|---|
| Primary | calibration | 0/156 | 0.0% | 0.063 |
| Primary | test | 0/209 | 0.0% | 0.068 |
| Exploratory | calibration | 0/156 | 0.0% | 0.045 |
| Exploratory | test | 0/209 | 0.0% | 0.041 |
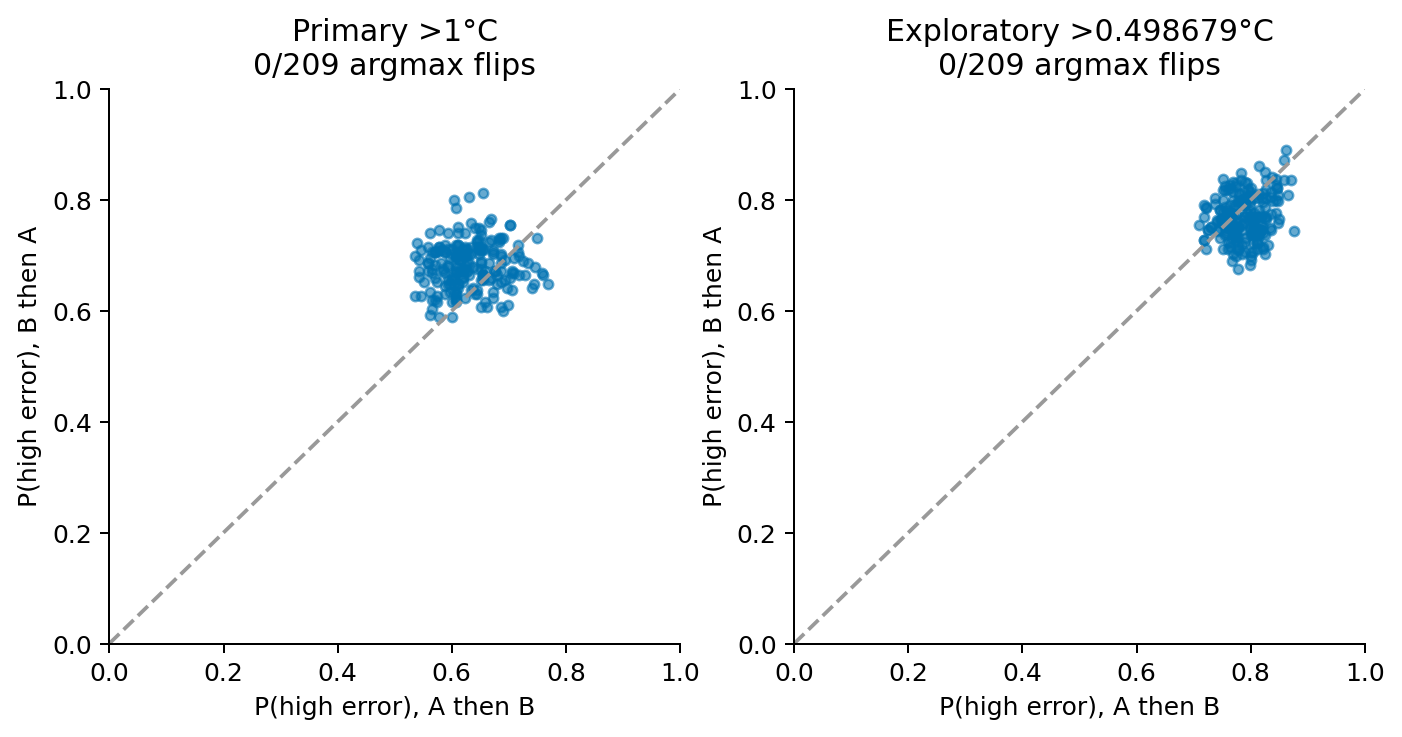
Figure 3. Raw high-error probabilities under canonical and reversed option order on the test set. Each point is one forecast date. The diagonal denotes equal probabilities.
| Exploratory gate | Retained n | Coverage | MAE °C | Event rate |
|---|---|---|---|---|
| Laya calibrated | 169 | 80.9% | 0.269 | 13.0% |
| Numeric logistic calibrated | 172 | 82.3% | 0.253 | 10.5% |
| Calibration constant | 209 | 100.0% | 0.270 | 12.9% |
The accepted subsets differ in realized coverage, so their errors do not constitute a matched-coverage comparison. A lower retained error can reflect discarding more forecasts, a genuinely informative ranking, or sampling variation. The source outputs also include the fixed-0.5 and calibration-selected F1 thresholds, false-negative rates and confusion counts for every method. No decision cost or acceptable miss rate was established for deployment.
6 Findings and analysis
The exploratory Brier comparison does not establish an advantage over the calibration constant: its paired interval does not lie wholly below zero (0.00013 (95% interval -0.00141 to 0.00157)). Recalibration can correct a systematic probability level without creating useful case-specific information.
The exploratory results do not support an incremental Brier advantage over calibrated numeric logistic (0.00338 (95% interval -0.00409 to 0.01222)). Numeric evidence already carries information about prior forecast performance. Encoding it in English and passing it through a frozen decision model must justify its extra implementation and runtime cost through measured benefit.
Across all 365 calibration and test cards, answer-order reversal changes 0.0% of primary and 0.0% of exploratory choices. The proposed 5% stability tolerance is met in this observed sample for the primary question. The stability check is specific to these two prompts and this evidence format.
The negative exploratory calibration slope reverses the raw probability ranking. Any post-calibration discrimination therefore arises from a mapping learned on the calibration sample, not from trusting the raw probability as a correctly oriented error-risk estimate. This makes a new holdout especially important.
Zero argmax flips coexist with uniformly high-error raw choices on all 365 cards for both endpoints. On test cards, changing order still shifts high-error probability by 0.0683 on average for the primary question and 0.0413 for the exploratory question. Meeting the flip criterion therefore does not establish useful classification or invariant probabilities.
The strongest completed contribution is methodological: public inputs, chronological separation, explicit task framing, preserved predictions, a transparent amendment, and direct tests that can expose a weak gate. A negative or inconclusive result is informative for choosing the next PhD experiment. It does not show that every future Laya adaptation must fail.
7 Limitations and next experiment
The study has one grid location, one target variable, one horizon and one historical test block. It cannot establish performance across Jamaica, the Caribbean or other seasons and variables. Reanalysis agreement does not establish independent station accuracy, spatial downscaling, physical consistency, extreme-event validity or climate-change attribution. No impact model, human decision utility or operational safety threshold is evaluated.
The original 1°C event is too rare in the fixed weekly samples to support strong probability or discrimination claims. One positive calibration example cannot establish calibrated population probabilities, and all primary discrimination metrics are unstable descriptive summaries. The exploratory threshold improves event support but changes the question after primary outcomes were inspected. Its interpretation must remain exploratory even though the numerical threshold uses only gate-training errors. The weekly evaluation also limits generalization to daily use, and a frozen 2001–2010 numerical forecast may be stale by 2025. This pilot does not seek the best available weather forecast.
A defensible next experiment would fix an application-relevant error event and operationally available inputs before examining a new evaluation period, estimate the required event count, and use independent stations and multiple locations. It should compare the same numeric and textual evidence, preserve calibration/test separation, and test option-order robustness as a prerequisite to deployment. The present experiment does not establish whether fine-tuning, larger models or multilingual input would improve results. Those are separate experiments.
8 Conclusion
This experiment establishes a runnable, auditable single-gridcell forecast-error gating pilot using a public 322M Laya checkpoint. The original 1°C endpoint is too sparse for a reliable skill conclusion. The amended threshold does not establish a consistent incremental advantage over the tested prevalence and numeric comparators. Answer-order robustness, adequate event counts and operational data availability remain essential requirements. The findings concern a decision-gate adaptation on retrospective gridded temperature data and do not validate operational forecasting, downscaling or physical climate simulation.
9 Reproducibility and implementation record
The final prediction file contains one retained record for each of the 365 fixed calibration and test cards, with four typed questions per card (two endpoints and two option orders), giving 1,460 decisions. The loaded model contains 321,908,995 parameters. Execution uses PyTorch 2.8.0+cpu, Transformers 4.57.6, Accelerate 1.10.1 and Laya 0.4.1 under Python 3.12.14, with two compute threads, one inter-op thread, one state per call and a 512-token limit. No input truncation or autocast failure occurred in the retained final outputs.
The planned default float32 load failed with exit code 137. A subsequent mixed-precision attempt encountered dtype errors and incomplete outputs were excluded. The final implementation loads parameters through a low-memory meta-parameter path, assigns the pinned checkpoint tensors, and explicitly converts all parameters to BF16 with autocast disabled. It retains the checkpoint architecture and performs no training. Numerical equivalence to a completed default-float32 reference was not established.
The final prediction file combines nine chronological process chunks. One interrupted process preserved its first 81 completed rows; resumed chunks supplied the remaining dates under the same settings. The interruption cause was not established. Boundary and repeated-card checks reproduced recorded probabilities and choices exactly. Summed inference time was 496.851 seconds (8.28 minutes), equivalent to 1.361 seconds per card or 0.340 seconds per typed decision in this run. Aggregate recorded model-loading time was 45.706 seconds. Maximum process resident memory was 1,493,612 KiB (about 1.42 GiB). These measurements exclude download duration, setup, failed attempts and process-launch overhead. Checkpoint download duration was not instrumented, and no cost or speed comparison with unrun models is claimed.
Descriptor tertiles use only the 2001–2010 numerical-fit-period raw features, rounded to three decimals before quantile calculation. Independent reconstruction matches every stored tertile exactly. The numeric gate imputer, standardizer and logistic model use 2011–2018.
On 8 October 2026, pinned BootLoops Emitall (commit 66b680ce742e654cfe86da4f072a69061fe182b1) checked 132 explicitly quoted claims against saved receipts: all 132 matched, with zero findings (exit 0). A negative control replacing the calibration count 156 with 157 produced 131 matches and one finding (exit 1), detecting the planted error. Brier values were recomputed from saved probabilities; order-flip counts were read back from the results summary. This verifies arithmetic consistency at specified precision, not scientific validity, raw-data correctness or omitted claims. The full BootLoops toolkit was not run.
The accompanying local research package preserves raw-request provenance, data checksums, processed observations, the original design and exploratory amendment, source code, evidence cards, predictions, metric outputs and figure data. The package version and model revision are pinned. Upstream code and weights are public, but this manuscript does not claim that the new study has been publicly released, externally registered or submitted to arXiv.
References
[1] NASA POWER Project. Data Sources. Accessed 8 October 2026. https://power.larc.nasa.gov/docs/methodology/data/sources/
[2] NASA POWER Project. Daily API. Accessed 8 October 2026. https://power.larc.nasa.gov/docs/services/api/temporal/daily/
[3] Gelaro, R., et al. (2017). The Modern-Era Retrospective Analysis for Research and Applications, Version 2 (MERRA-2). Journal of Climate, 30(14), 5419–5454. https://doi.org/10.1175/JCLI-D-16-0758.1
[4] Laya Contributors. Laya source repository. Python package 0.4.1 used in this study. https://github.com/NandhaKishorM/laya
[5] ConvAI Innovations. Laya Multilingual model card and checkpoint. Revision 1720e3e3357cfe1e281542e223f8273b0890ca34. https://huggingface.co/convaiinnovations/laya-multilingual
[6] Gneiting, T., and Raftery, A. E. (2007). Strictly Proper Scoring Rules, Prediction, and Estimation. Journal of the American Statistical Association, 102(477), 359–378. https://doi.org/10.1198/016214506000001437
[7] Guo, C., Pleiss, G., Sun, Y., and Weinberger, K. Q. (2017). On Calibration of Modern Neural Networks. Proceedings of Machine Learning Research, 70, 1321–1330. https://proceedings.mlr.press/v70/guo17a.html