Introduction and related work
The question is whether a small nonlinear residual model improves intermediate-hour temperature reconstruction beyond interpolation and a strong train-only calendar baseline. The intended use is methodological evaluation before a regional forecast-resolution study. The spatial and hourly downscalers released by Scharfmann and Rasul provide the motivating endpoint-conditioned design[1], [2]. Their learned grids, terrain and targets concern France; the present networks are independently authored and freshly trained. They are neither executions of those checkpoints nor reproductions of their architecture.
The published source uses a U-Net[3], whereas the present controlled test uses a 305-parameter multilayer perceptron. Prior statistical super-resolution and diffusion downscaling methods establish that learned local detail is an existing research area[4], [5]. This study makes no novelty claim for residual downscaling. Its contribution at this stage is a reproducible three-location evaluation with explicit information timing and a strong baseline.
Data and study design
NASA POWER provides hourly-average meteorological estimates at native source resolution[6]. The 18 responses contain 157,824 temperature records across six years and three requested coordinates: Jamaica 17.93N,77.77W; Barbados 13.19N,59.54W; Puerto Rico 18.22N,66.45W. Responses identify MERRA-2 as their source[7]. Each coordinate selects a gridded estimate, not a thermometer at that precise location.
UTC is requested explicitly. Source calendars, units, hashes and finite values are checked before use. Intervals that would cross a year boundary are excluded. The split contains 65,715 training records, 21,885 validation records and 43,830 evaluation records. All three locations appear in training, so results do not test transfer to an unseen island. Reanalysis products were retrieved retrospectively; historical issue-time availability is not established.
The later endpoint of each six-hour interval is deliberately available to every model. This is legitimate for reconstruction from a completed coarse sequence, but it rules out interpreting the experiment as a forecast issued at the earlier endpoint. An operational study must instead supply endpoints from the same archived forecast issue and verify their errors independently.
Methods and numerical checks
For an interior hour at fractional position between endpoint temperatures and , the baseline is The neural reconstruction is The factor ensures exact endpoint agreement. It does not express conservation of atmospheric heat and the model is not a physics-informed neural network solving a heat equation. Temperature need not vary monotonically within an interval, so no monotonicity restriction is imposed.
Inputs are the two temperatures, fractional hour, sine/cosine representations of UTC hour and day of year, latitude and longitude. Standardisation uses training records only. Two hyperbolic-tangent hidden layers have 16 and 8 units. Three random seeds are trained with Adam; the 1,500-step and 3,000-step checkpoints are compared using validation root-mean-square error. Each seed selects 3,000 steps. The matched linear residual baseline uses the same inputs and endpoint factor, with ridge strength selected from 0.01, 1 and 100 on validation alone. A separate calendar baseline learns the residual mean by site, month and hour from training only.
All 305 analytic gradients were checked by finite differences; the largest absolute discrepancy was . Checkpoints, predictions and data hashes are retained. Accuracy refers to agreement with MERRA-2 estimates, not independent environmental truth.
Results
| Model | RMSE(C) | MAE(C) |
|---|---|---|
| Linear interpolation | 0.511 | 0.351 |
| Calendar correction | 0.189 | 0.127 |
| Ridge residual | 0.379 | 0.284 |
| Neural seed101 | 0.174 | 0.120 |
| Neural seed202 | 0.176 | 0.120 |
| Neural seed303 | 0.182 | 0.126 |
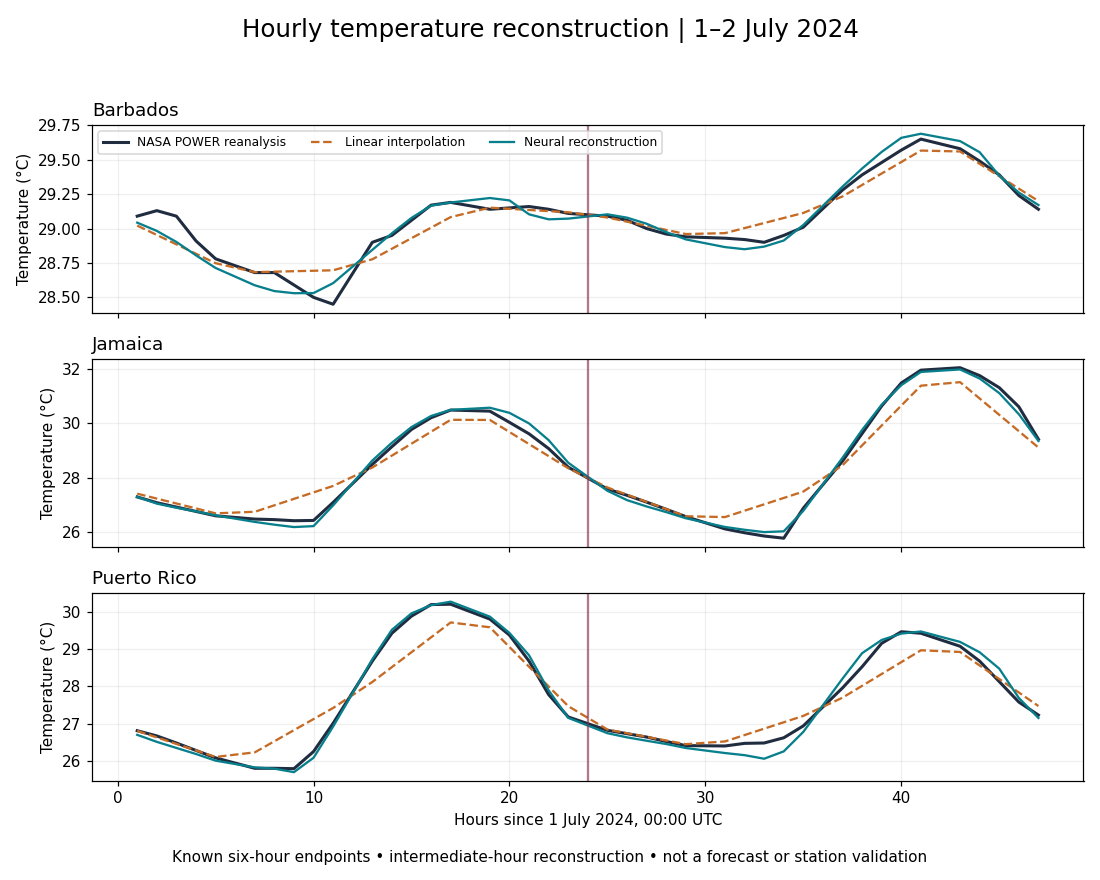
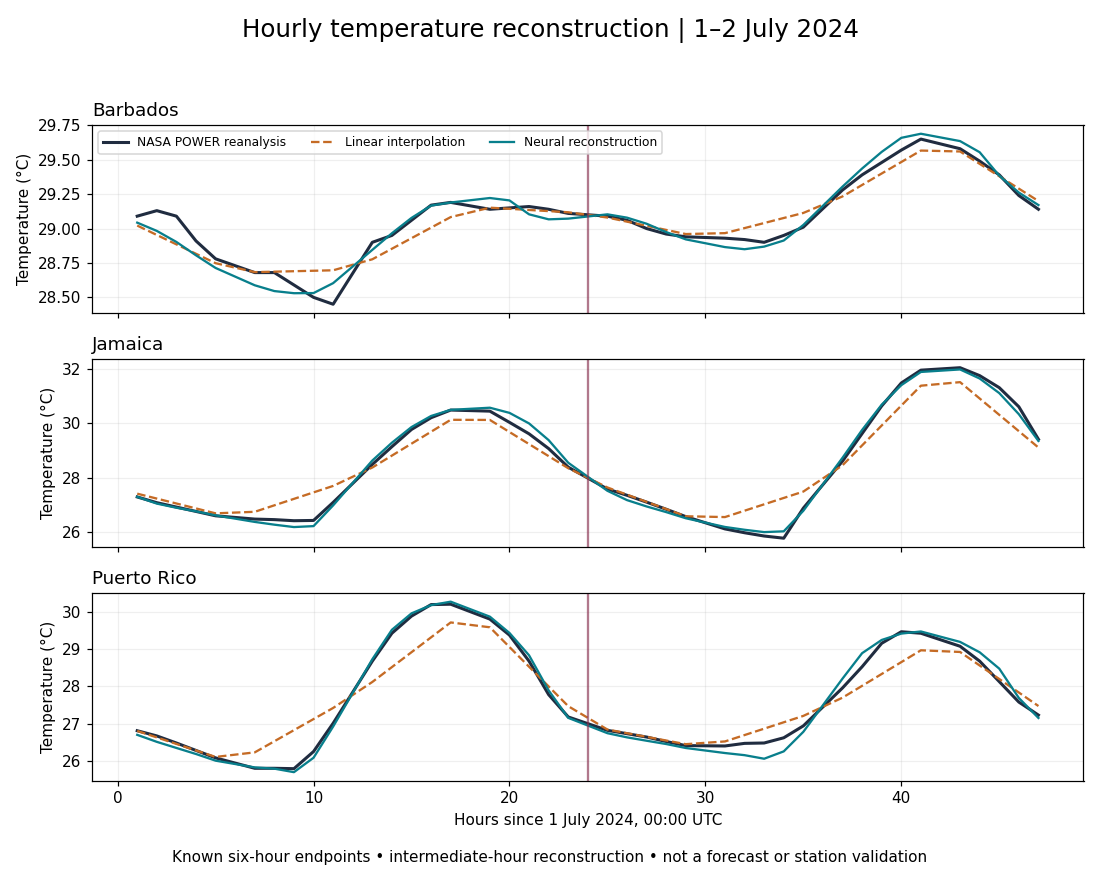
For the lowest-validation-error network, site RMSE is 0.201C in Jamaica,0.084C in Barbados and 0.209C in Puerto Rico. The calendar baseline is better at Barbados, with 0.081C. Aggregate performance therefore must not be presented as uniform island-level superiority.
A 2,000-resample bootstrap groups all three sites on the same UTC day. For seed101, the mean squared-error difference relative to the calendar baseline is with a percentile interval of. Grouping preserves same-day inter-island dependence, but not multi-day serial dependence; the interval is conditional and may be too narrow for longer weather episodes. Post hoc circular moving-day block checks retain all three locations together. Seven-day and 30-day blocks give intervals of and , respectively, against the calendar baseline. These sensitivity intervals do not address nonstationarity or independent observational error.
The root-mean-square error of the maximum across intermediate hours in each day is 0.131C for seed101, compared with 0.153C for the calendar baseline. This diagnostic deliberately excludes known six-hour endpoints and is not the error of the complete observed daily maximum.
For adjacent withheld hours, the seed 101 network has a temperature-change error of C per hour, slightly worse than the calendar baseline (C per hour). Lower pointwise error therefore does not imply improved temporal derivatives.
Discussion: spatial transfer and thesis relevance
CERRA provides European regional targets and does not cover the Caribbean[8]. The France checkpoints carry regional static fields and normalisation; replacing only the latitude labels would not be a scientific adaptation. A Caribbean spatial experiment requires paired coarse inputs and defensible fine-grid targets, terrain and land fractions, plus independent stations. Those inputs have not been assembled here, and no spatial downscaler has been trained in this checkpoint.
The thesis can use this experiment as a resolution-reconstruction benchmark, separate from its atmospheric physics model. A later test should compare unconstrained and physically constrained models with the same inputs, training budgets and splits. Boundary agreement is a useful numerical property, but heat-budget consistency requires radiation, turbulent fluxes, advection and storage terms with appropriate units and closure assumptions. Temperature reconstruction cannot establish rainfall or flash-flood skill.
Limitations and future work
Next steps are regional fine-grid target acquisition, island-held-out and event-held-out tests, archived forecast endpoints, independent station comparisons and multi-day block uncertainty. Surface grids are especially limiting for small islands and mixed land–sea cells. Calibration and probabilistic scores are required before interpreting ensemble samples as uncertainty. A single clear satellite image is context, not an optimising predictor; a matched, quality-controlled image time series must be tested through an input ablation.
The original Hugging Face model cards and mixed-source weight terms were inspected. The linked code repository did not expose a root software licence at inspection. No original source code or weights were imported, copied or executed. The current independently written implementation avoids treating public availability as unrestricted redistribution permission. This report does not establish a deployable Caribbean weather product.
Conclusion
The endpoint-constrained network reconstructs the selected reanalysis series more closely than linear interpolation, but the calendar comparator remains competitive and outperforms it at Barbados. Endpoint agreement and pointwise error must be assessed separately from temporal-rate accuracy and atmospheric physics. These results provide a bounded reconstruction benchmark rather than evidence of forecast or spatial-downscaling performance.
Data and code availability
Source responses, code, trained weights and evaluation records are retained privately. No public archive of the study’s analysis package is currently provided. The references below identify the official data and method sources; they do not provide access to the private evaluation package.
References
E. Scharfmann. France temperature downscaler. Model card. https://huggingface.co/EmmaScharfmann/france-temperature-downscaler.
K. Rasul. France hourly temperature downscaler. Model card. https://huggingface.co/kashif/france-temperature-hourly-downscaler.
O. Ronneberger, P. Fischer and T. Brox. U-Net: Convolutional networks for biomedical image segmentation. 2015. https://arxiv.org/abs/1505.04597.
T. Vandal et al. DeepSD: Generating high resolution climate change projections through single image super-resolution. 2017. https://arxiv.org/abs/1703.03126.
M. Mardani et al. Residual corrective diffusion modeling for km-scale atmospheric downscaling. 2025. https://doi.org/10.1038/s43247-025-02042-5.
NASA POWER. Hourly API documentation. https://power.larc.nasa.gov/docs/services/api/temporal/hourly/.
R. Gelaro et al. The Modern-Era Retrospective Analysis for Research and Applications, Version 2 (MERRA-2). 2017. https://doi.org/10.1175/JCLI-D-16-0758.1.
Copernicus Climate Change Service. CERRA sub-daily regional reanalysis data for Europe on single levels. https://doi.org/10.24381/cds.622a565a.